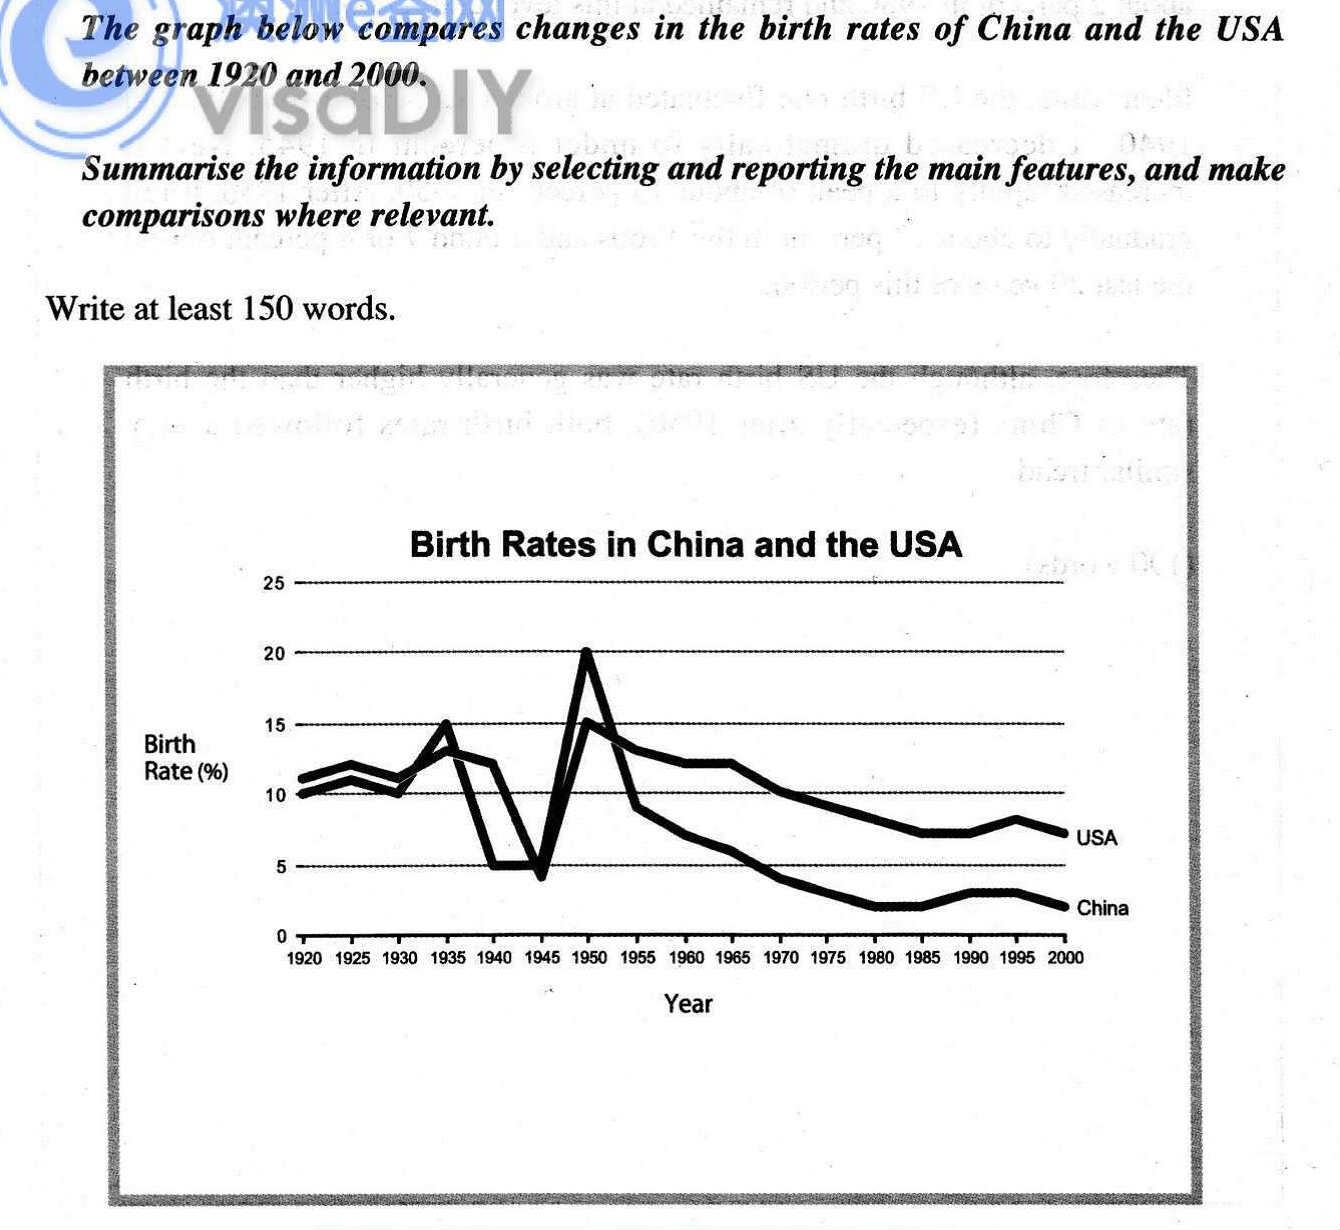
The line graph shows that the alteration of the birth rates in different countries over a period of 80 years.
It is evident that the birth rate of each country fluctuated between 1920 and 2000. China is expected to see the most dramatic changes in its fertility.
Although the figures of China jumped markedly, there was a rapid decline during the period from 1920 to 1945. However, in 1950, the percentage of China fertility reached a peak of 20%. Interestingly, the figures of China saw a considerable fall until the end of the 2000s, to approximately 2%.
Comparing the USA fertility, we can see that the figure fluctuated between 1920 and 1940, then slide away to less than 5% and started climbing a peak of more than 15% in 1950. It is interesting that the percentage of America births saw an exponential drop until the end of the period, similar to China birth rate. (154)

saa.jpg
