TASK 1
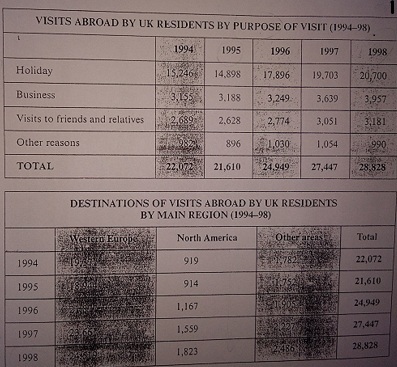
The first chart below shows the result of a survey which sampled a cross-section of 100,000 people asking if they traveled abroad and why they traveled for period 1994-98. The second chart shows their destinations over the same period.
The charts compare between a number of visits abroad and the destination in the period 1994-98. It can be seen that people of Western Europe are the highest number for visiting vacation.
According to the chart, in 1998 went up visitor about 20,700 only for getting long weekend. Then, the next reason was 3,957 for searching a job; 3,181 for visiting their families; and 990 for another intention.
Then the second chart shows that Western Europe have dominated about 24,519 in 1998. After that, it was following by North America approximately 1,823 and by other regions around 2,486. This data showed if the journey to be on holiday increased for traveling in Western Europe than North America at 1,823.
Note - you will be suspended if you continue posting WEAK advice in other students' topics.

278234_1_o.jpg
