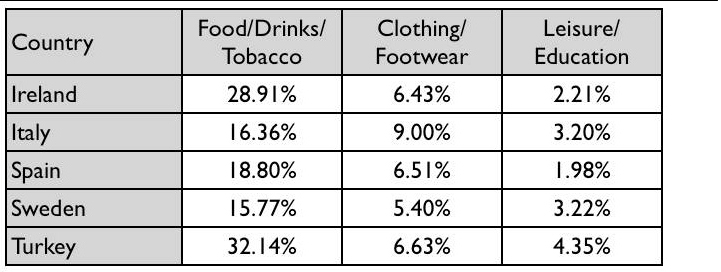
The given table has clearly compared the contribution of three different categories on national consumer expenditure amongst five countries in 2002.
It is clear that larger percentages of the expenditure were spent on food, drink and tobacco, whilst leisure and education accounted for only mere minorities. Interestingly, Spain had the lowest ratio for the latter.
As can be seen from the figures, cigarette, food and drink held the highest proportion of nearly one third in Turkey, which was almost doubled that in Sweden. Otherwise, spending roughly three out of ten of the expenses on the same category, Ireland ranked second. Simultaneously, Ireland came second in term of country spending least on leisure and education, that was just over a half as high as Turkey (2.21 percent and 4.35 percent respectively).
As referring to clothes and footwear, comprising exactly nine percent, it was more common in Italy than other countries. At the same time, Sweden was at the bottom of the list with only a tiny minority of 5.4 percent. Finally, clothing and footwear made up similar amounts of approximately 6.5 percent in three other countries, namely, Ireland, Spain and Turkey.

212883_1_o.jpg
