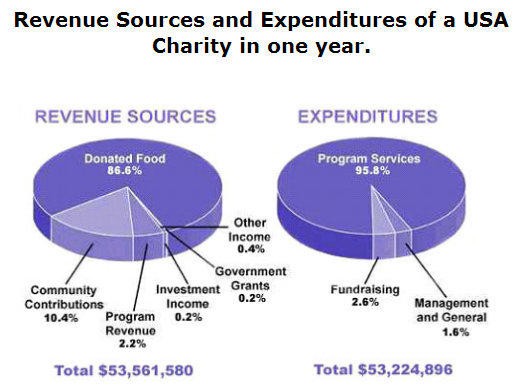
These two pie charts compare the income fund and spending activities of USA charity in a year. In general, the first chart shows that the highest revenue is denoted by donated foods while the largest percentages of expenses allocated in program services.
In a year, people in USA contributed most in charity by donated food, it take rates of 86.6%. The other sponsorship is from community contribution which take the second highest rate in 10.4%. Program revenue has assembled fund in about 2.2%, while investment income, government grants and other income indicators only collect a little amount of money less than one percent.
USA used most of the sources to financed the program services, it cost 95.8% in total expenses. To gain more revenue, they did fundraising program which used 2.6% of the money. Finally the expended to management and general activities just solely used the less fund. Overall, the sum of income has gained profit in about $336,684 depleted by the expenditures.

ES7.png
