Writing task 1: Ielts - Line Chart
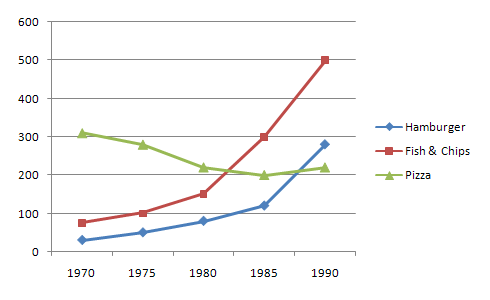
The given graph shows the consumption of fast food in the UK (per week) from 1970 to 1990.
The mentioned line chart elucidates the expenditure of fast food in United Kingdom weekly in the period of 1970 to 1990.
As it can be seen from the chart, hamburger and fish and chips showed an upward trend while the opposite was true for pizza over the span of 20 years from 1970 to 1990. Interestingly, in this period, fish and chips had the most significant changes.
In 1970, pizza was by far the best fast food consumed by inhabitants in the UK at over 300 grams. Meanwhile, the consumptions of hamburger and fish and chips were about 30 and 80 grams respectively. The period between 1970 and 1980 witnessed a marginal drop in the expenditure of pizza while the others increased gradually.
After 1980, there was a rise at 150 grams in the consumption of fish and chip, but later hit the highest point, reaching 500 grams in 1990, which was a surprise. Similarly, the forenamed of hamburger reached a peak at approximately 290 grams. Nevertheless, the expenditure of pizza experienced a steady fall and hit the lowest point at 200 grams, but later went up moderately at 210 grams.

line4.gif
