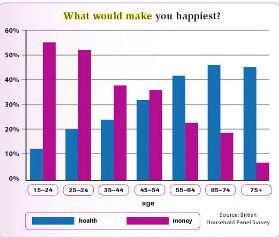
The graph below and the chart on the next page show the answers people gave about the extent to which they are satisfied with their lives and what they think would make them happiest.
The graph provides information about satisfaction with life according to different age and the chart is about things that make people happy across age groups. Overall, it can be seen that the least happiness occur in young age by having money, while money for older people do not make them happy.
In the beginning, both men and women have different satisfying score when men's score is 5.5 and women's score is 5.3. After that, they have similar pattern in 21-30 age group until reach a bottom in 41-50 age group with score 5. In the following years, the trend is upward and hit a high point at 5.6 for everyone age 61-70.
Young people say that money make them happy and decrease sharply in the following age group. On the other hand, health begins from the bottom at about 10 percent and increase to above 40 percent in age more than 75. There is a cross in age group 45-54 between health and money to make people happy.

The Graph
The Chart
