Write a report for a university lecturer describing the information in the two graphs below.
- You should write at least 150 words.
- Allow yourself 20 minutes for this task.
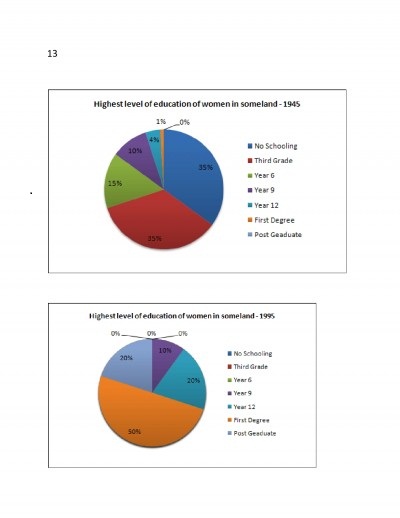
The given pie charts reveal information about the education levels of women in Someland in the years 1945 and 1995. The educational levels includes the percentage of women completed third grade, six years, nine years and twelve years of schooling, first degree, post graduation and no schooling. It is evident that the education level of women increased remarkably in 1995.
In 1975, there were an equal proportion of women who had first degree and not attended the school, which was 35%. Only 15% of women completed their six years in school, whereas, 10% women finished their nine years of schooling. There was only 4% of women was interested to complete their 12yrs of schooling and 1% of women had first degree.
On the contrary, the levels of womens' education shoot up after a period of fifty years, in 1995. Half proportion of the women, 50% completed their first degree. Those who had completed twelve years schooling and post graduation had shared equal proportions of 1/5th of the total, 20%. There was a significant rise in the number of women in these two categories, 16% and 20% respectively. In the same period, the number of women finished their nine years of schooling remained without any change, 10%.
In short, in 1995, the first degree holders percentage showed the highest level of increase 49%, nobody has interested to stop their education after six years of schooling or three degree. After a half century, the awareness of educational importance increased among the women of Someland.
Write a report for a university lecturer describing the information in the two graphs below.
- You should write at least 150 words.
- Allow yourself 20 minutes for this task.
- You should write at least 150 words.
- Allow yourself 20 minutes for this task.
The given pie charts reveal information about the education levels of women in Someland in the years 1945 and 1995. The educational levels includes the percentage of women completed third grade, six years, nine years and twelve years of schooling, first degree, post graduation and no schooling. It is evident that the education level of women increased remarkably in 1995.
In 1975, there were an equal proportion of women who had first degree and not attended the school, which was 35%. Only 15% of women completed their six years in school, whereas, 10% women finished their nine years of schooling. There was only 4% of women was interested to complete their 12yrs of schooling and 1% of women had first degree.
On the contrary, the levels of womens' education shoot up after a period of fifty years, in 1995. Half proportion of the women, 50% completed their first degree. Those who had completed twelve years schooling and post graduation had shared equal proportions of 1/5th of the total, 20%. There was a significant rise in the number of women in these two categories, 16% and 20% respectively. In the same period, the number of women finished their nine years of schooling remained without any change, 10%.
In short, in 1995, the first degree holders percentage showed the highest level of increase 49%, nobody has interested to stop their education after six years of schooling or three degree. After a half century, the awareness of educational importance increased among the women of Someland.
Write a report for a university lecturer describing the information in the two graphs below.
- You should write at least 150 words.
- Allow yourself 20 minutes for this task.

13.jpg
