TOPIC:
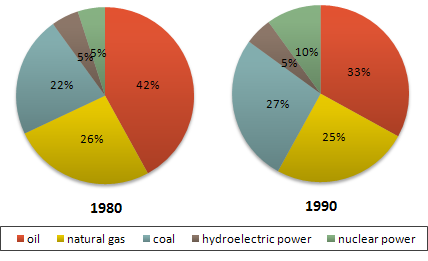
The two graphs show the main sources of energy in the USA in the 1980s and the 1990s.
Write a report for a university lecturer describing the changes which occurred.
Write at least 150 words.
WRITING:
These two graphs reveal the main sources of energy in America in the 1980s and the 1990s separately. It consists of five different sources such as oil, natural gas, coal, hydroelectric power and nuclear power.
In 1980, Americans use oil mostly. It is forty-two percents in the main sources of energy. Natural gas and coal are both almost a quarter in the graph of 1980. Hydroelectric and the nuclear are the smallest usage of all.
After 10 years, in 1990, oil was still the largest source of energy, but it decreased to one in three. The second source changed from natural gas into coal. Apparently, nuclear in 1990 was twice than 1980, it moved from five percents to ten percents. In conclusion, the first and second largest sources such as oil and natural gas were all doped down. Both coal and nuclear power increased. Hydroelectric did not change obviously through the ten years.
Thank you very much!

G113.png
