Unanswered [1]
  

Home / Writing Feedback   % width   Posts: 3


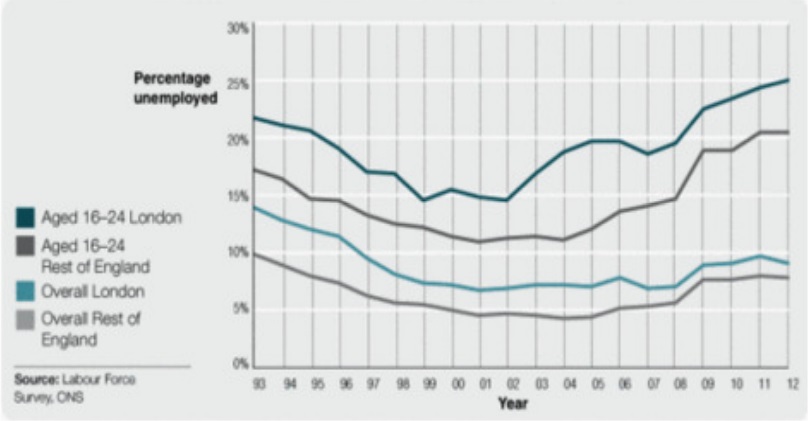
The graph below shows changes in young adult unemployment rates in England between 1993 and 2012.


nguyenanhduc1998 1 / 1  
Feb 24, 2021   #1

the percentage of people without job - London and rest of England


The line graph compares the level of people who are out of work in 4 groups of London and England during the period from 1993 to 2012.

Overall, it is clear that the proportion of jobless people decreased from 1990 to 2002. Besides, the rate of between job young man is higher than overall.

In 1993, the levels of unemployment people aged 16-24 were around 22% and the figure for those living outside of London was 5% smaller, at 18%. Whiles level of jobless people fall down significantly during 10 years, the trend for higher levels in London and among young adults continued.

From 2002, there was an upward trend in the level of jobless young people in England and London. The proportion of those rose dramatically by around 20% in both. However, the rest people of London and people live outside London without work remained below 10%

  • 1.jpg


Holt  Educational Consultant - / 15461  
Feb 25, 2021   #2
The first error I have to point out, is the under writing in this essay. You are required to write at least 150 words or face penalties for writing under the minimum word requirement. You are short by 2 words so, you can expect a minimal percentage deduction in your TA score. Though minimal, it could still have a strong effect on your final score. Remember, essays that do not present more than the minimum word count are usually seen as being under developed and little analyzed. Try to write 175 words next time to better meet the more than adequate writing standards for the test. The way to increase your word count and GRA scoring considerations will be by changing the way you present the information from the image. Rather than using only commas to separate the information presentation, creating a pause, but not a break that helps with the clarity and coherence of the presentation, use a variation of punctuation marks instead, with a focus on period (.) usage. That way you give your chance to truly create an acceptable mix of simple and complex sentence presentations within the paragraphs. Right now, you present only 2 long sentences per paragraph. Aim to write at least 3 up to 5 sentence per paragraph to allow for a better data analysis presentation and comparison on your end.
OP nguyenanhduc1998 1 / 1  
Feb 25, 2021   #3
essayforum.com@gmail.com

Thank you so much. I will try to improve in the next essay.


Home / Writing Feedback / The graph below shows changes in young adult unemployment rates in England between 1993 and 2012.
ⓘ Need Writing or Editing Help?
Fill out one of these forms for professional help:

Best Writing Service:
CustomPapers form ◳

Graduate Writing / Editing:
GraduateWriter form ◳

Excellence in Editing:
Rose Editing ◳

AI-Paper Rewriting:
Robot Rewrite ◳