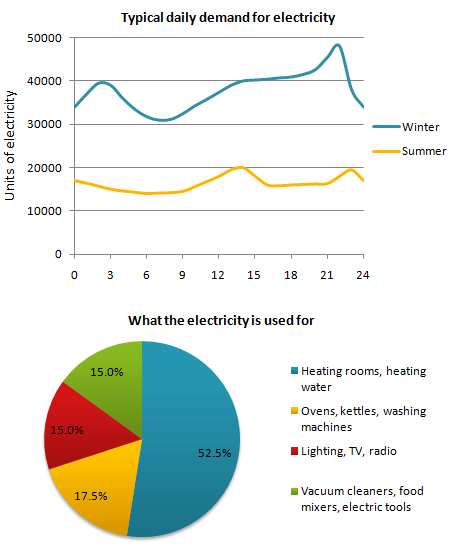
The graph below shows the demand for electricity in England during typical days in winter and summer. The pie chart shows how electricity is used in an average English home.
A line graph provides information about the main trends in the demand of electricity during winter and summer in England, while a pie chart illustrates what electricity is used for in an average English household.
The first graph reveals that people are using more electricity in winter than in summer. The consumption of electricity during typical day in winter is between 30,000 and 44,000 units, whereas in summer people usually use only from 12,000 to approximately 20,000 units of electricity. Both in winter and summer the high peaks of electricity usage is met at about 9 or 10 PM. The least demand for electricity happens to be in early mornings between four and nine.
The second chart explains why the usage of electricity in different times of the year has such a sharp contrast. The pie char shows that 52.5% of the electricity in an average English home is used for heating process. Moreover, ovens, kettles and washing machines consumes 17.5% of electricity followed closely by the house lighting, TVs and radios which cover 15% of the electricity in an average English household. The same amount of electricity is utilized for vacuum cleaners, food mixers and other electric tools.
Overall, it seems that the amount of electricity used during the day is coherent to the need of keeping the house warm.
221 words

g122.png
