Hi everyone, I would really appreciate that you will take a look at my essay and so I really hope to receive your comments and feedback about my writing skill and score it if possible. Thank you so much for your help. Have a nice day.
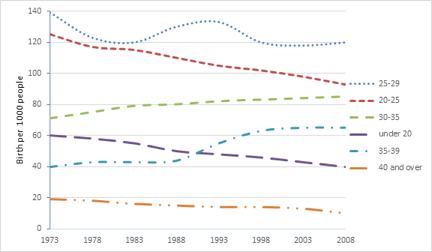
The line graph compares the changes in the birth rates among UK women in 6 age groups between 1973 and 2008.
As conspicuous from the statistics, there was a downswing trend in the birth rates in under-30 and over-40 age groups. Additionally, an opposite inclination was observed in the remaining groups.
In 1973, the highest birth rate was recorded among women who were 25-29, at 140 per thousand people. After several fluctuations, this figure modestly went down to exactly 120 and still retained its dominant position by 2008. Meanwhile, for women aged 20-25, the number of births decelerated rapidly by roughly 30 to hit the bottom at 90. This was considerably higher than the figure for women under 20, which declined steadily by 20 to 40 after nearly 4 decades. Among under 40-year-olds, the birth rate dropped slightly from 20 to 10.
In contrast, the birth rate for 30-35-year-old women increased gradually from 70 to over 80 in 2008. Over the same period, there was also a growth in the 35-39 age group, slowly rising from 40, then abruptly surging to hit a peak of 62.
(182 words)
statistics of the birthrate in the uk
The line graph compares the changes in the birth rates among UK women in 6 age groups between 1973 and 2008.
As conspicuous from the statistics, there was a downswing trend in the birth rates in under-30 and over-40 age groups. Additionally, an opposite inclination was observed in the remaining groups.
In 1973, the highest birth rate was recorded among women who were 25-29, at 140 per thousand people. After several fluctuations, this figure modestly went down to exactly 120 and still retained its dominant position by 2008. Meanwhile, for women aged 20-25, the number of births decelerated rapidly by roughly 30 to hit the bottom at 90. This was considerably higher than the figure for women under 20, which declined steadily by 20 to 40 after nearly 4 decades. Among under 40-year-olds, the birth rate dropped slightly from 20 to 10.
In contrast, the birth rate for 30-35-year-old women increased gradually from 70 to over 80 in 2008. Over the same period, there was also a growth in the 35-39 age group, slowly rising from 40, then abruptly surging to hit a peak of 62.
(182 words)

Task1_0.png
