IELTS WRITING TASK 1
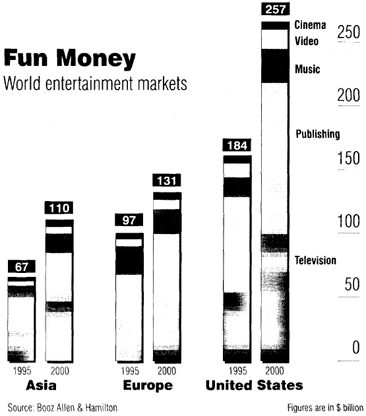
The graph below shows how much money was spent on different forms of entertainment over a five-year period.
You should write at least 150 words.
================================================================= ========================
The bar chart illustrate the amount of money in billion, which was spent on various types of fun in Asia, Europe and the US in the years 1995 and 2000.
Overall, in all three places, in 1995 people spent less money on entertainment than in 2000.
In Asia, in 1995, society spent on TV and publishing the most ( more than 50 billion dollars on both of them ), and on music, video and cinema only about 15 billion. After 5 years, the chart jumped to 110 billion, because spending on TV rose twofold and also publishing and music expanded slightly.
In Europe, in 1995, the bar chart started from 97.000 million dollars. It had more than 30 billion spent on TV, publishing and more than 20 billion on music. Video and cinema changed negligible in the year 2000, while television and publishing entertainment rose steeply and the figure reached a peak of 131 billion dollars invested in fun.
In the United States, it can be seen that figures were bigger than in the other places. In 1995, people spent more than 50 billion on TV and more than 70.000 million dollars on publishing. Music, video and cinema had changed slightly by 2000. In the year 2000, the bar chart reached a new high of 257 billion, because the TV fun increased to 100 billion and publishing grew up to 110 billion.
To sum up, it is clear that in Asia, Europe and the US, people invest more money on TV and publishing than the other types of entertainment.

funmoney1.png
