IELTS Task 1 - birth and death rates in New Zealand
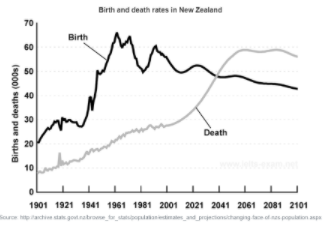
The graph below gives information about changes in the birth and death rates in New Zealand between 1901 and 2101.
Summarise the information by selecting and reporting the main features, and make comparisons where relevant.
The given graph illustrates the dynamics of the birth and death rates in New Zealand during the period of 1901 and 2101.
According to the graph, the birth rate, although it shows some fluctuation, was noticeably higher than the death rate and reached its maximum in the year 1961. However, it is projected that the death rates continue to grow exponentially and are predicted to surpass the birth rate in 2041.
Comparing the birth rate prior to the 2000s, the numbers started at 20,000 in 1901 and rose dramatically during a 60-year period and finally exceeded the peak of 60,000 by 1965. After some fluctuation in 2010, the number later plummeted and followed a descending trajectory for the rest of the period.
Conversely, the death rate increased gradually every year with a starting point of less than 10,000. Since 2001, the number climbed from 28,000 to nearly 60,000 in shortly 40 years. It then steadies at a rate of 58,000 after the year 2061.

birthrateinnewze.png
