This is my essay for the topic mentioned. Thanks to all evaluate <3
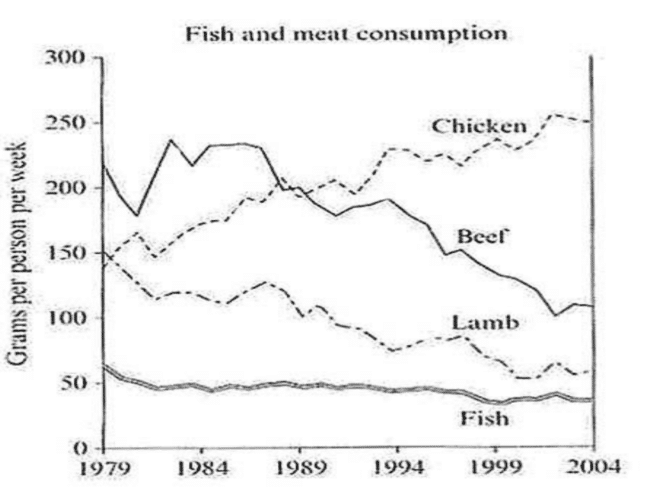
The line graph illustrates the amount of four different kinds of meat namely chicken, beef, lamb, and fish that a citizen of a European country consumed weekly from 1979 to 2004.
Overall, it is evident that while the consumption of chicken increased, the opposite was true for the intake of beef and lamb. Also, fish remained the least popular meat during this period.
In 1979, beef was the most favored meat at over 200 grams per person per week. Chicken and lamb were eaten in similar quantities at around 150 grams. It can also be seen that the intake of fish is only one third that of chicken or lamb.
Between 1979 and 2004, the country witnessed a massive change as chicken consumption rose continuously and hit its peak of around 250 grams per person per week. The contrast can be observed for beef and lamb as the amount eaten for both kinds of meat dropped more than half. Similarly, fewer fish was eaten in the country, with its figure declining by about 15 grams per week.
THE GRAPH BELOW SHOWS THE CONSUMPTION OF FISH AND SOME DIFFERENT KINDS OF MEAT IN A EUROPEAN COUNTRY
The line graph illustrates the amount of four different kinds of meat namely chicken, beef, lamb, and fish that a citizen of a European country consumed weekly from 1979 to 2004.
Overall, it is evident that while the consumption of chicken increased, the opposite was true for the intake of beef and lamb. Also, fish remained the least popular meat during this period.
In 1979, beef was the most favored meat at over 200 grams per person per week. Chicken and lamb were eaten in similar quantities at around 150 grams. It can also be seen that the intake of fish is only one third that of chicken or lamb.
Between 1979 and 2004, the country witnessed a massive change as chicken consumption rose continuously and hit its peak of around 250 grams per person per week. The contrast can be observed for beef and lamb as the amount eaten for both kinds of meat dropped more than half. Similarly, fewer fish was eaten in the country, with its figure declining by about 15 grams per week.

task1cam7test2.pn.png
