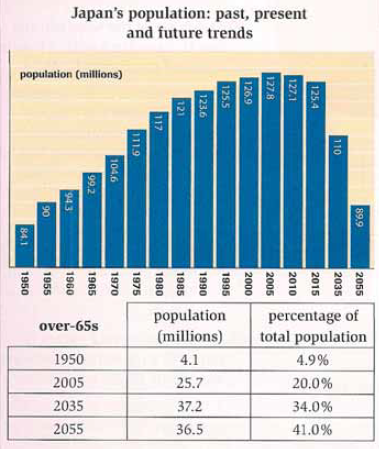
The bar chart shows Japanese residents measured in million, while a breakdown of the proportion of people age 65 and more between 1950 and 2025, a 105-year period is presented in the table.
Overall, there has been an upward trend in Japan's demography and population aged more than 65 years old. However, inhabitant in Japan is predicted slum up over the future 40 years.
According to the chart, the total of inhabitants in Japan increased considerably from 84.1 to 127.8 million between 1950 and 2005. It was the highest number of Japanese people and then declined sharply to 125.4 million in 2005. However, it will drop significantly to 89.9 million in 2055.
In contrast, there was a gradual rise in the number of Japan's demography. The proportion of total population of resident aged over-65s stood at a very small number (4.9%) in 1950. It will rise to around two fifths (41.0%), the largest number of residents aged more than 65 years old.

gambar_bar_chart.png
