FISH AND MEAT CONSUMPTION
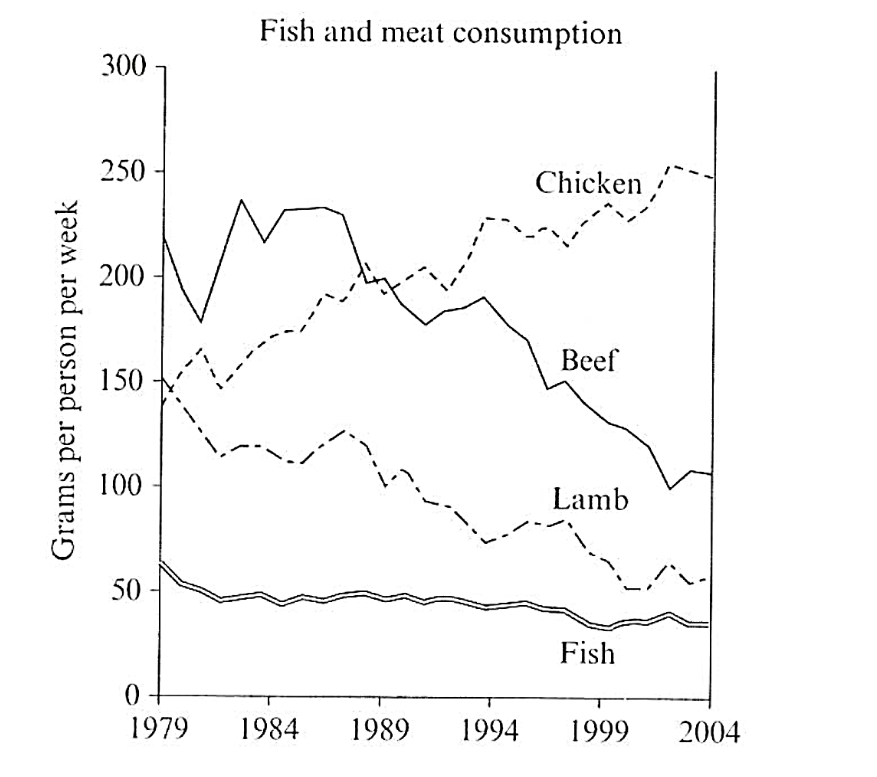
The line chart compares the demand for 4 different types of meat and fish in a European country over the period between 1979 and 2004.
It can be seen clearly from the chart that the overall trend was downward, as the level of consumption for three of four types dropped during the period shown, at different rates. In particular, there were dramatic decreases for lamb and beef, while fish saw a comparatively slight drop. By contrast, the demand for chicken boomed, going from 3rd to the highest at the end of the period.
The consumption of beef began the period with the highest, at over 220 grams per person per week. In 1984, it stayed at almost the previous same amount, after experiencing several periods of solid up and down. The figure dramatically dropped and hit its trough in 1999 (100 grams per person per week), before recovering gradually to over 120 grams at the end of the period. In contrast, chicken started in the 3rd place, with the weekly amount of 140 grams per person, but rosed remarkably and hit its peak at over 260 grams in 2002. Its demand then fell moderately until finished up in 2004 with the highest consumed level of 250 grams.
Turning to lamb, a citizen in the country ate over 150 grams of lamb per week in 1979, but the demand decreased by 30% after 20 years to about 60 grams. It then ended the period at the same amount. Similarly, fish consumption slightly decreased from 70 to 50 grams in the first 3 years before stalling at around 50 grams until the end of the period.

257295433_2724587248.png
