Unanswered [1] | Urgent [0]
  

Home / Writing Feedback   % width   Posts: 3


The line chart illustrates the proportion of visitors who went to four distinct places in Edinburg


banngoc16 1 / -  
Jun 6, 2021   #1

tourists in Edinburgh


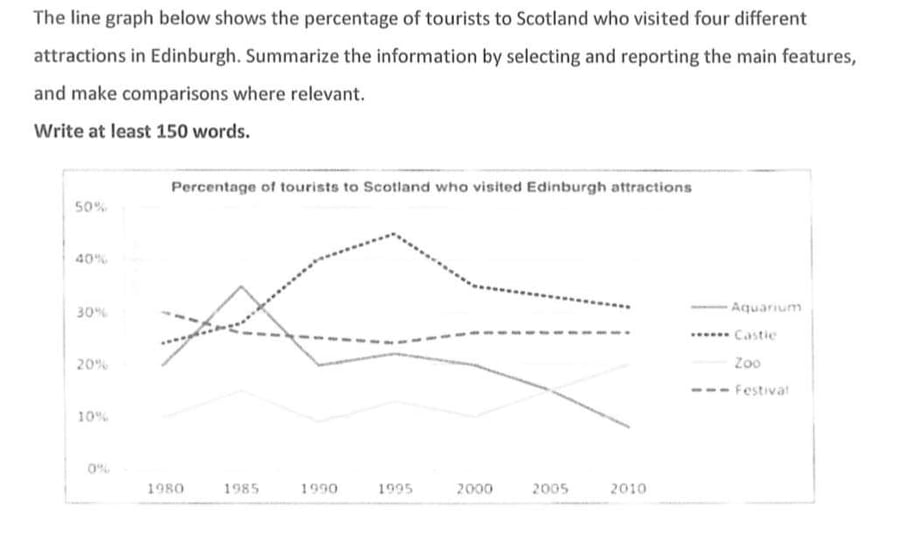
The line chart illustrates the proportion of visitors who went to four distinct destinations in Edinburg, Scotland.

Overall, the number of tourists visiting zoo and castle showed an upward trend, whereas that of aquarium and festival followed a downward trend.

From 1980 to 1985, the percentage of visitors to both places underwent a modest rise. Between 1985 and 2000, a period of 15 years, that of castle witnessed a dramatic surge, outstripped the number of aquarium tourists and peaked at 45 percent in the year 1995. Meanwhile, that of zoo fluctuated slightly. Then, from 2000 to 2010, the tourists coming to zoo rise considerably and eventually surpassed that of aquarium in 2005. In sharp contrast to this, the percentage of visitors coming to castle slowly declined.

Between 1980 and 1985, the number of visitors to aquarium suddenly rose to about 35 percent, while that of festival witnessed a mild decline. From 1985 to 2000, the percentage of tourists coming to festival experienced a gentle fluctuation, then, to the rest of the timescale, it reached a plateau of about 25 percent. Meanwhile, that of aquarium witnessed a sharp fall from 1985 to 1990, a period of 5 years. In the next 5 years, it rose slight. After that, from 1995 to the end of the timescale, it experienced a marked plunge.

  • task1linechart.jp.jpg


Holt  Educational Consultant - / 15384  
Jun 7, 2021   #2
The line chart

slightly incorrect image identification . This isa line graph, not a line chart. By definition:

chart - noun; a sheet exhibiting information in tabular form.

graph- noun; a diagram representing a system of connections or interrelations among two or more things by a number of distinctive dots, lines, bars, etc.

Both words are nouns but the words describe two distinctly different images. Use the correct definition for the image for accuracy. On the plus side, you did a good job enumerating the locations in the trending statement . That's always helpful in the initial scoring segment.

both places

what places. Always inform regarding the source of comparison points.

that of castle

Is this in reference to the previous statement? Make that reference clear. Otherwise you lose GRA (stress regarding comprehension on the part of the reader) and C + C points ( due lack of statement clarity).

a gentle fluctuation

The lowest and highest points being? The comparison is incomplete.

it rose slight

marked plunge.

To what measurement levels? This creates confusion in the statement. You are risking further score reductions in the GRA and C + C sections. These issues could very well be the reason for a reduced overall score.
lethiaixuan 2 / 4  
Jun 7, 2021   #3
who went to four distinct destinations: It should be in simple present in introductory part
and rose slight -> slightly


Home / Writing Feedback / The line chart illustrates the proportion of visitors who went to four distinct places in Edinburg
Do You Need
Academic Writing
or Editing Help?
Fill out one of these forms:

Graduate Writing / Editing:
GraduateWriter form ◳

Best Essay Service:
CustomPapers form ◳

Excellence in Editing:
Rose Editing ◳

AI-Paper Rewriting:
Robot Rewrite ◳

Academic AI Writer:
Custom AI Writer ◳