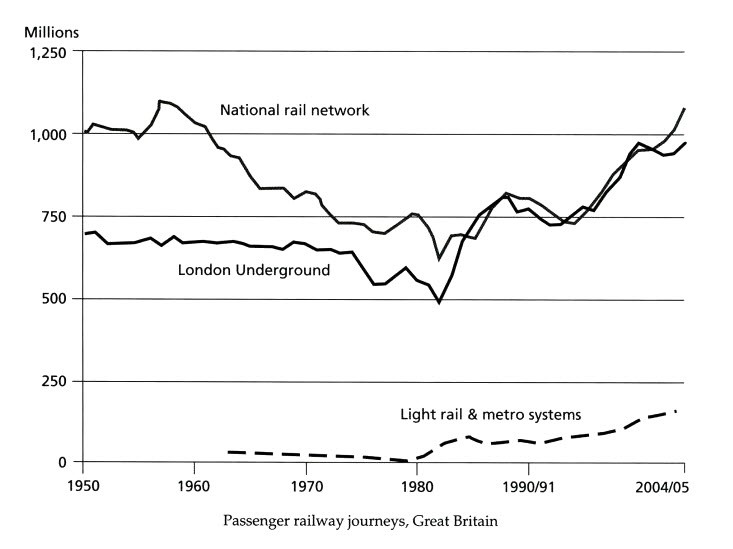
The graph shows the number of passenger railway journeys made in Great Britain between 1950 and 2004/5
The line graph compares the figures for travel by British people using 3 different systems of railway over a period from 1950 to 2004/05.
It is clear that the light rail & metro system is by far the least popular throughout the period shown. Also, while the number of people who used London underground and light rail & metro systems increased, the number of national rail passengers dropped slightly.
In 1950, the national rail network and the London Underground were used by 1000 million and around 700 million people respectively, whereas light rail & metro system remained the least popular choice until the year 1980. The national rail network users reached a peak of nearly 1100 million in 1960 and fell by roughly 400 in the 1980s. During the same period, London underground fell steadily to 500 millions passengers
By 2004/05, a considerably increase in the number of users can be seen for the underground, with a jump of nearly 600 millions and from around 1982. Also, the figures for national railway and metro systems rose considerably to nearly 1000 million and 150 million commuters.

graph.jpg
