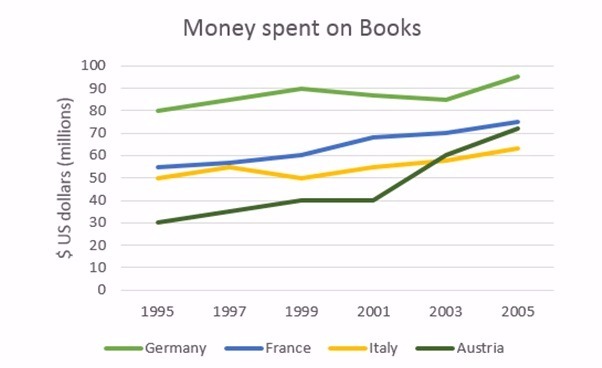
The line graph shows the amount of book expenditure for 4 different euro countries; Germany, France, Italy and Austria, during a decade from 1995 to 2005 and is measured in million US dollars. Overall, it is important to note that France, Austria and Germany had a little deviation in book purchasing in the end of 2005. Then, Austria rose sharply for the last following 5 years than other countries.
Germany and France were the majority in book purchasing. Germany stood at 80 million dollars in 1995, which the higher than 3 countries. The trend rose significantly during first four years but there was then a gradual fall during next four years, though it increased again to approximately 95 million dollars in 2005. However, the France trend grew noticeably over 20 years
In contrast, Italy and Austria had a similar pattern. From 1995 to 1999 saw a significant growth for the amount of Austria book expenditure but there was then a stable to 2001. Following this, the expenditure rose rapidly to finish period at more than 60 million dollars which approached the second majority. By 1995 to 1997, Italy trend fluctuated though they increased markedly the following years

AvpbEjeorP4886dxrs9.jpg
