Dear forum! Thank you in advance for some comments. I'm preparing for the IELTS exam and I would like to hear your feedback on my essay.
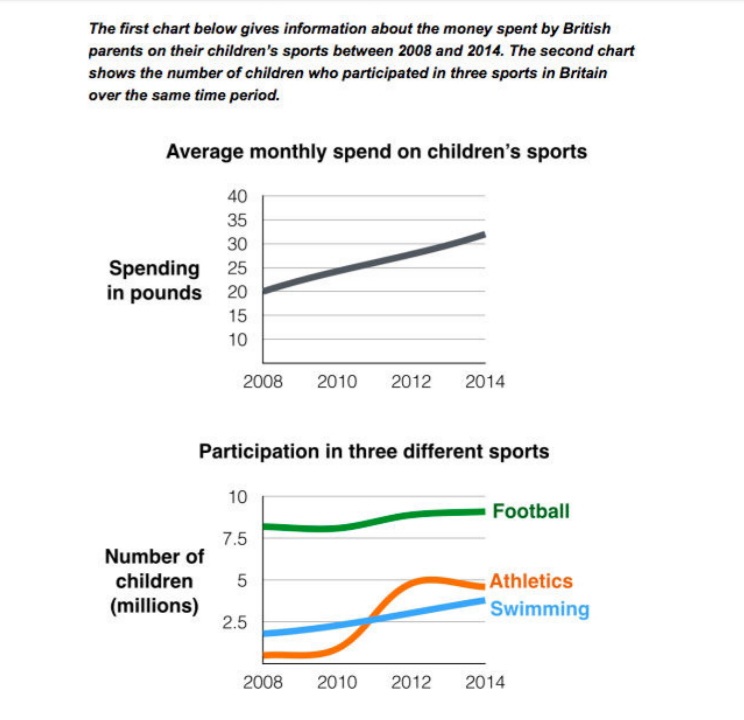
The first chart provides information about how much British parents spent on their children's sports every month and the second chart presents how many children took part in three sports from 2008 to 2014.
Overall, the figure for average monthly spending experienced an upward trend. The number of participants in three sports saw an increase, albeit at different rates. However, football remained more popular than athletics and swimming.
The figure for parents' spending stood at 20 pounds at the beginning of the recorded period. By then there was a gradual increase over the following six years, before this data climbed to over 30 pounds in 2014.
Looking at the participation numbers, there were 7.5 million children who played football in 2008, while the number of swimmers was nearly 2.5 million and that of athletics participants was just less than 1 million.The following years witnessed a dramatic increase in the quantity of kids practicing athletics and swimming. In particular, the figure for swimming and athletics experienced a twofold and fivefold increase respectively. In the meanwhile, football just witnessed a slight rise but still remained as the highest figure over the time frame.
money spent on children's sport / participation in different disciplines
The first chart provides information about how much British parents spent on their children's sports every month and the second chart presents how many children took part in three sports from 2008 to 2014.
Overall, the figure for average monthly spending experienced an upward trend. The number of participants in three sports saw an increase, albeit at different rates. However, football remained more popular than athletics and swimming.
The figure for parents' spending stood at 20 pounds at the beginning of the recorded period. By then there was a gradual increase over the following six years, before this data climbed to over 30 pounds in 2014.
Looking at the participation numbers, there were 7.5 million children who played football in 2008, while the number of swimmers was nearly 2.5 million and that of athletics participants was just less than 1 million.The following years witnessed a dramatic increase in the quantity of kids practicing athletics and swimming. In particular, the figure for swimming and athletics experienced a twofold and fivefold increase respectively. In the meanwhile, football just witnessed a slight rise but still remained as the highest figure over the time frame.

20210107_213230.jpg
