Ielts task 1 - line graph shows changes in the amount of fast food consumed by Australian teenager.
consumption of junk food among Australian teenagers
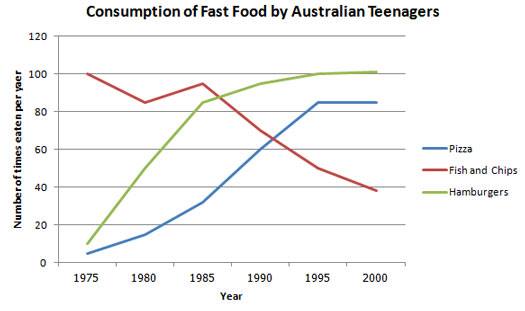
The provided line graph gives the information about the consumption of junk food eaten by teenagers in Australia over the period from 1975 to 2000. As is observed, the usage of pizza and hamburgers showed an upward trend, meanwhile, fish and chips declined over the period shown.
In 1975, fish and chips were the most popular fast food to youngsters with 100% of consumption, compared to about 5% of pizza and 10% of hamburgers. The following 10 years, it showed the oscillation before plunging sharply to just beneath 40% in 2000.
In contrast, the young tended to eat pizza and hamburgers. In 1990, the amount of consumed pizza overtook that of fish and chips, followed by a stability from 1995 to 2000. Hamburgers presented the fastest growth in 3 types of fast food, which passed over others in 1985 and finished at the begging level of fish and chips with the consumption at 100%.Holt Educational Consultant - / 15990 The lack of graphic image as referred to in your essay will prevent me from properly reviewing your presentation. I do not have a comparison point for your information and what was actually provided to you for the report creation. What I can tell, is that you haven't written enough words to aim for a high scoring task 1 essay. you only wrote 154 words when a better scoring report would have contained at least 175-190 words. That type of writing is aiming for only a low band score. You may not be able to achieve a passing score with such a low word count presentation.
This happened because you did not write at least 3-5 sentences per paragraph. By writing the proper sentence number per paragraph, you will be able to aim for a higher overall score. 2 sentences do not qualify as a complete paragraph. The standard definition of a paragraph is any written presentation with at least 3 sentences contained within. You only wrote 2 sentences per presentation, opting to use a comma to represent a new thought process instead of using a period to indicate the next sentence presentation.
The presentation does not have enough of a simple and complex sentence mix to score well in the GRA section. Rely less on commas and more on varied punctuation marks to indicate your thought process. Show an advanced sentence composition method whenever you can.
Please provide the image next time you post and essay. It will help me provide you with a better assessment of your work. Without it, I can only give you general reviews, which will limit the writing help that I can give you.
(WARNING! DO NOT POST THE IMAGE FOR THE OP! DO SO AT YOUR OWN RISK!)
@Holt
Thanks for your comment. Anh this is a graph of this task. Can you help me to check it again? Thanks so much.
And I have a question. Is it nessary to write 3 sentences per paragraph? Beacause I see the word limit in Ielts task 1 is at least 150 words.
Hope that you will reply to me.

nhtask1.jpg
| Home / Writing Feedback / Ielts task 1 - line graph shows changes in the amount of fast food consumed by Australian teenager. |
ⓘ Need academic writing help? 100% custom and human!

