Please comment on the essay and give a band if you can
I have attached the graph with this post
Thank you very much :)
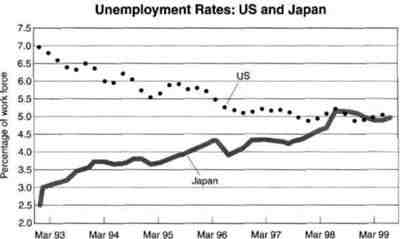
THE GRAPH SHOWS THE UNEMPLOYMENT RATES IN THE US AND JAPAN BETWEEN MARCH 1993 AND MARCH 1999.
The line graph compares the unemployment rates in the US and Japan over a 6-year- period (March 1993 - March 1999). It is clear that the rate of unemployment in the US declined gradually over the period. Whereas, the rate of unemployment in Japan increased throughout the period.
In March 1993, compared to the unemployment rate in the US, about 7.0% of the work force; Japan had the lowest rate of unemployment (about 2.5% of work force)
Two years later, the rate of unemployment in Japan rose from 2.5% to 3.6% approximately, while the rate of unemployment in the US had dropped from 7.0% to 5.5%. Although the rates of unemployment in both countries had a big difference in the starting points but by March 1999, the rates of unemployment in both countries were the same - 5.5%.
In summary, the rates of unemployment in two different countries had different rates of unemployment but they both ended up at the same percentage by March 1999.

task1linegraphun.jpg
