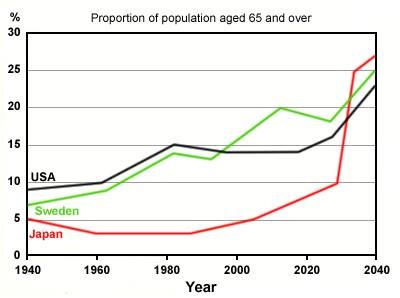
The line graph illustrates the proportion of elderly people in three different countries, USA, Sweden, and Japan. Overall, it can be seen that the portion of elderly citizens in all countries rises between 1940 and 2040.
To begin, from 1940 to 1980, the percentage of aged people in USA and Sweden stood at 9% and 6% respectively in 1960, and then increased slightly to 10% in Japan and 8% in Sweden in 1960. Afterwards, the population experienced gradual increase to 15% in the next year. Conversely, population of aged people in Japan witnessed slow decline. It was stood at 5% in 1940 and then decreased minimally to 3% in 1960. Next, the portion of elderly people in Japan was stable between 1960 and 1980.
Subsequently, in the following three decades, all the countries saw an upward trend and a peak. The population of aged people in japan reached a high of 27% in 2020 and it was the higher level than other countries which reached a peak at 25% in Sweden and 23% in USA.

WT1_proportion_elder.jpg
