Hello everyone, here is my first essay for practice in IELTS Writing Task 1. I made it for 25 minutes, and I really need your suggestion to make it perfect :)
Proportion of population aged 65 and over - IELTS Writing Task 1 Practice
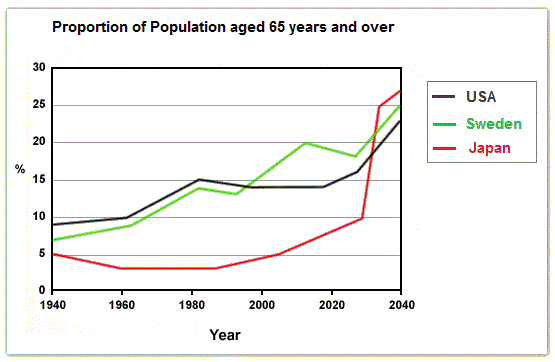
The line graph compares the percentage of the people age 65 and more among USA, Sweden, and Japan for over a century.
The most noticeable trend is that Japan shoot up throughout the period after gradually rebound in some decades., whereas USA and Sweden rise steadily until 1980. Although the three countries had experienced the drop in several decades, but in general they shows the significant increasing by 2040.
In 1940, around 9 percent of Americans are an elderly people while 7 percent and 5 percent of Swedish and Japanese respectively. USA and Sweden were started to grow the people by more than 5 percent until 1980. On the contrary, Japan had fallen its population slightly in 1940 and stayed at the same level of 3 percent by 1990.
An Elderly population in three countries will predict to increase by 2040. USA and Sweden expect to grow at the same proportion to 23 percent and 25 percent, on the other hand, Japan is predict to increase significantly in the higher percentage.

Academic_IELTS_Writi.jpg
