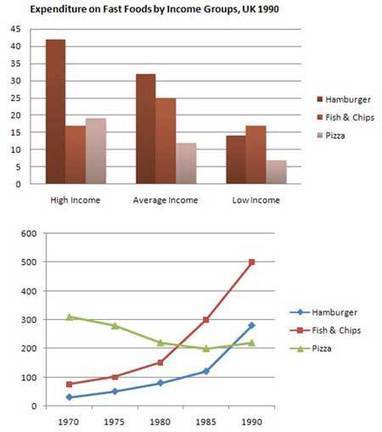
The number of purchases on hamburger, fish & chips and pizza in UK, classified by income in 1990, are delivered in the bar chart, while the line graph shows the rate of those foods starting from 1970 to 1990. Overall, cost on hamburger and pizza reduced as level of income became lower. It can also be noted that the demands on fish & chips and hamburger kept on moving upward in every year.
Total expenditure on hamburger was the higher than other foods, and high income level need to be highlighted, which by far the greatest, at about 42. Interestingly, this number was as twice as both remaining foods in the same level. In addition, most people with average income also preferred to choose hamburger than others. Overall, low level of income spent the least on those foods.
In 1970, pizza was the most popular food, at more than 300, three times more than pizza and fish & chips. However, in the remaining periods it declined, while others improved significantly, especially in fish & chips which climbing a peak, stood at 500, in 1990. Astonishingly, pizza, which was the most popular, became the least in 1990.

Multiple sets of data
