export earnings (2015-2016)
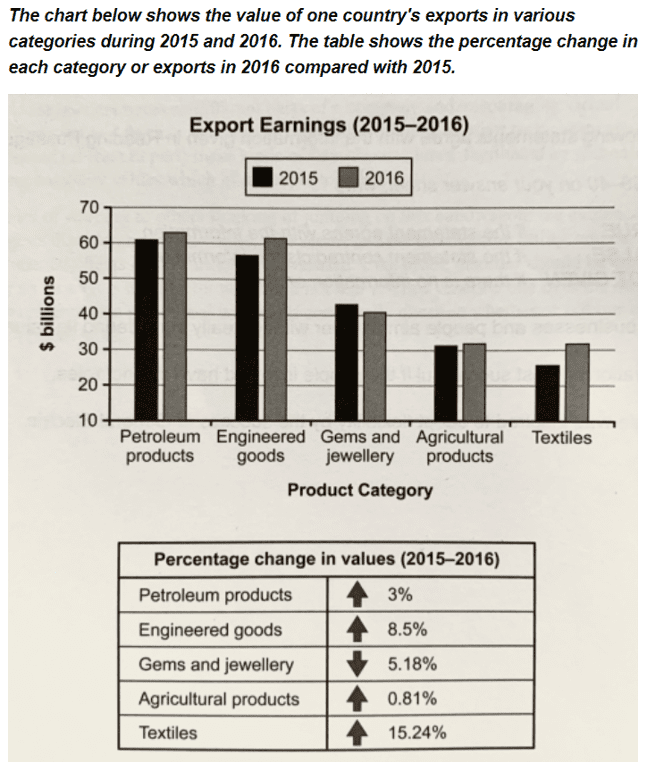
The provided graphs demonstrate the transformation of export profits in terms of five export product categories in one country namely: petroleum products, engineered goods, gems and jewellery, agricultural products and textiles, by illustrating both changes in actual amount of earnings and percentage between year 2015 and 2016.
In general, four out of five export merchandises earning values experienced an upward trend from 2015 to 2016, except the one of gems and jewellery that decreased with a drop from approximately 43 to 41 billion. In particular, the petroleum products remained the most profitable among the five export goods during the time period, gaining 61 and 63 billion respectively.
As is observed from the given bar chart and table, the percentage of textiles value presented the sharpest upturn by 15%, which made it reach the total profit value identical to that of agricultural products in 2016 (32 billion). Whereas agricultural products value percentage merely altered by lower than 1 percent (+0.81%).
It is also noticed that the 8.5% rise in engineered goods value stands as second-place amid all percentage shifts, which brought its total earning (62 billion) gradually closer to the revenue of petroleum products(63 billion).

11.png
