You should spend about 20 minutes on this task.
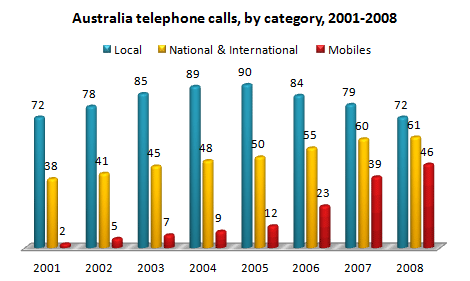
The bar chart below shows the total number of minutes (in billions) of telephone calls in Australia, divided into three categories, from 2001- 2008.
Summarise the information by selecting and reporting the main features and make comparisons where relevant.
Write at least 150 words
The bar graph compare the total number of minutes made over an eight-year period from 2001 to 2008 in the selected country Australia. The study was deviated into three sections: local, national and international, and mobile.
To begin with, the local category has an increasing then decreasing trend. Beginning at 72 billion minutes, it is considered to be the largest number of minutes in 2001 when compared to the other two categories. Then, slightly increasing until reaching its peak at 2005, namely 90 billion minutes. Afterwards, it began to slightly decrease to have the same number of minutes dialed in 2001.
Moreover, when it comes to national and international calls made, the number of minutes was slowly increasing from 38 in 2001 to 61 in 2008. As can be observed, the difference between the number of minutes made in 2001 and in 2008 was 23 which is not very large unlike the number of minutes in mobile phones where the difference between the first and the last years of study was 44. Clearly, the trend in mobile section saw an increasing trend similar to that of the national and international.
All in all, trends in national and international and mobiles were always increasing throughout the years. It can be concluded that, over the years, the number of minutes was always the highest in local calls and the lowest on mobile calls.

IELTS_Writing_Task_1.png
