Please give me score for this writing and help me to improve it by giving some suggestions. Thanks
-----------------------------------------------------------------------------------------------------------------------------------
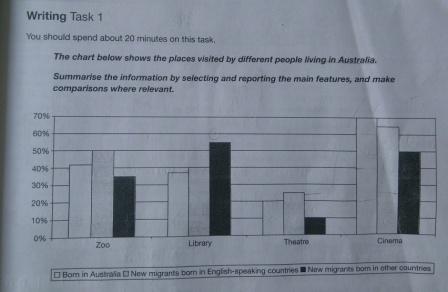
Task 1 IELTS: The chart below shows the places visited by different people living in Australia
The bar chart indicates the percentage of three different visitors living in Australia who visit four different locations classified into zoo, library, theater, and cinema. These visitors are divided into those born in Australia, new migrants born in English-speaking countries, and new migrants born in other countries. What stands out from the data reveals that cinema is the most popular place among all places and the greatest rate in every location is broken up by different visitor category.
To begin with, all visitors have common interest in cinema and visitors born in Australia shows the highest interest at virtually 70%. Nevertheless, both cinema and theater percentage illustrate enormous difference. The lowest interest of visitors is described in theater rate with only less than 25% visitors.
Furthermore, major percentage of different place is peaked by different visitor category. The new migrants born in English-speaking countries category hit two greatest rates in library and zoo location. Its rate in zoo place is slight under the percentage of the highest one in Library place reaching the percentage above 50%. Surprisingly, the point of those born in Australia is identified as the highest rate not only in cinema but also entire places.

task_1_unit_3.jpg
