Hi all,
I'm really confused about which grammar I should use to describe an overal trend from the past to future. (1940 - 2040). Hopefully, someone can give me as well as other candidates an useful advice.
Thanks a lot.
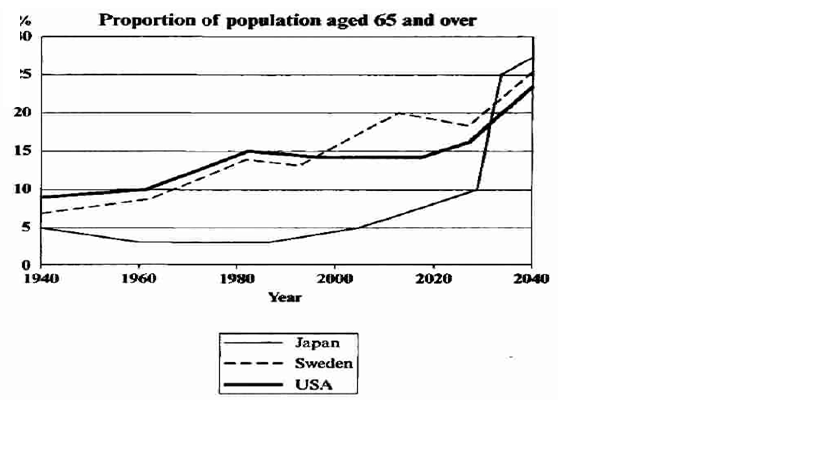
The graph below shows the proportion of the population aged 65 and over between 1940 and 2040 in three different countries. Summarize the information be selecting and reporting the main features, and make comparisons where relevant.
The line chart reveals the changes in the rates of people at the age of 65 years old and over from 1940 to 2040 in Japan, Sweden and USA. As a whole, those propotions all have gone up over this 100-year period.
More specifically, the proportions of those aged 65 and over in USA grew from nearly 10% in 1940 to exactly 15% in early 1980s and is forcasted to keep rising to well under 25% in 2040, despite of a slightly decrease between 1980 and 2020. Sweden also experienced a similar trend when its rate of people aged 65 and over stayed at approximately 7% in 1940 and constantly peaked in early 1980s, early 2010s and 2040 at under 15%, exactly 20% and just over 25%, respectively. In regard to Japan, it has the lowest proportion of people from the age of 65 upwards from the beginning of the examining period until early 2030s with only 5% in 1940 and 10% by the end of 2030. From that point onwards, this rate showed a magical growth as surpassing USA and Sweden to become the country which has the highest proportion of people aged 65 and over with 25% in early 2030s and about 27% at the end of the period.

Untitled.png
