Hello guys, please help me with this essay!
Thank you
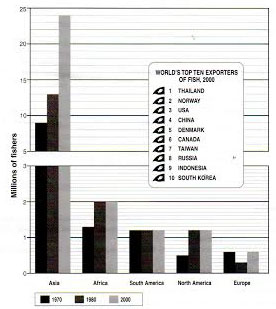
The chart and table show the number of fishers in millions for different regions between 1970, 1980, and 2000, and the world's top ten exporters of fish in 2000.
A comparison of the number of people who make a living by fishing in Asia, Africa, South America, North America, and Europe from 1970 to 2000, a 3-decade period measured in millions of people is illustrated in the bar chart. The table shows the main fish producer from 10 different countries in the world.
Overall, it is immediately apparent that in thirty years the population of fishers increased in all regions, but a reverse were experienced by South America and Africa. In this case, Asian countries witnessed the highest rise from all and dominated the half of world fish market in 2000.
In 1970, the highest number of world fishermen was living in Asia, and the figure shows a significant rise, from 9 millions to 24 millions within 30 years. Standing at just under 1.3 millions, Africa came second position in the population of the fish catchers. There was a dramatic rise in the number of fishers in Africa, 0.7 millions in three decades. Likewise, the graph for North America also went up significantly to 1.2 million people in the question period. The data of South American fishers remained virtually unchanged, about 1.2 millions. There was a fluctuation in the total fishers in Europe, with the least number from all, but then the 2000 figure recovered to that of 1970.
A closer look at the table shows that the first position of top ten fish exporters in 2000 was settled by Thailand. Following this, Norway and USA broke a record as the second and third place respectively. While Indonesia and South Korea contributed the least number of fish in the world, the figures for China and Taiwan hovered at 4th and 7th rank, above those of Indonesia and South Korea.

fish.jpg
