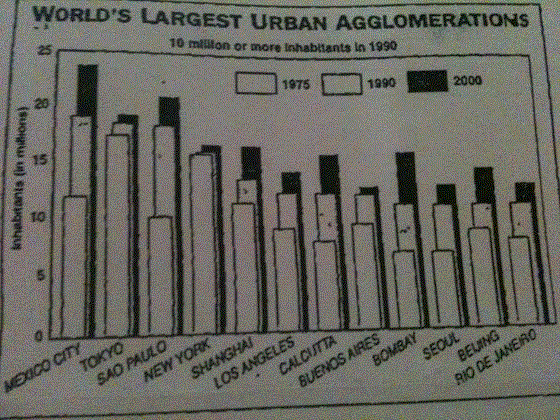
This column graph illustrates the information about different population growth rates in some of the world's super cities. Between 1975 and the year 2000/ some of the cities are shown to experience changes in population, but within individual cities and in comparison with other cities. The indications are shown in millions.
First and foremost, this graph rose gradually from 1975 to 2000 and it had only upward trends.
One must note that Mexico City by 2000 was the most crowded city and the highest indication belonged to it (24 million), whereas the last index in 2000 belonged to Aires (14 million).
To begin with, in 1975 Tokyo and New York cities had unmatched numbers of population, but they stayed stable till 2000 and the index increased insignificantly. The same cannot be observed with Sao Paulo, because it had not so significant number of population in 1975, but by 2ooo it arrived at its climax (21 million).
In 1990, Mexico City, Tokyo, Sao Paulo had almost the same indications (about 19 million) and these cities dominated in this period. But by 2000, the distinctions among the populations of these cities increased.
By way of conclusion, the numbers of population in these cities were various in every period and almost each period had different leaders.
(213 words)

20140318_IMG_0355.gi.gif
Finished.gif
