variety of livestock and fish consumption
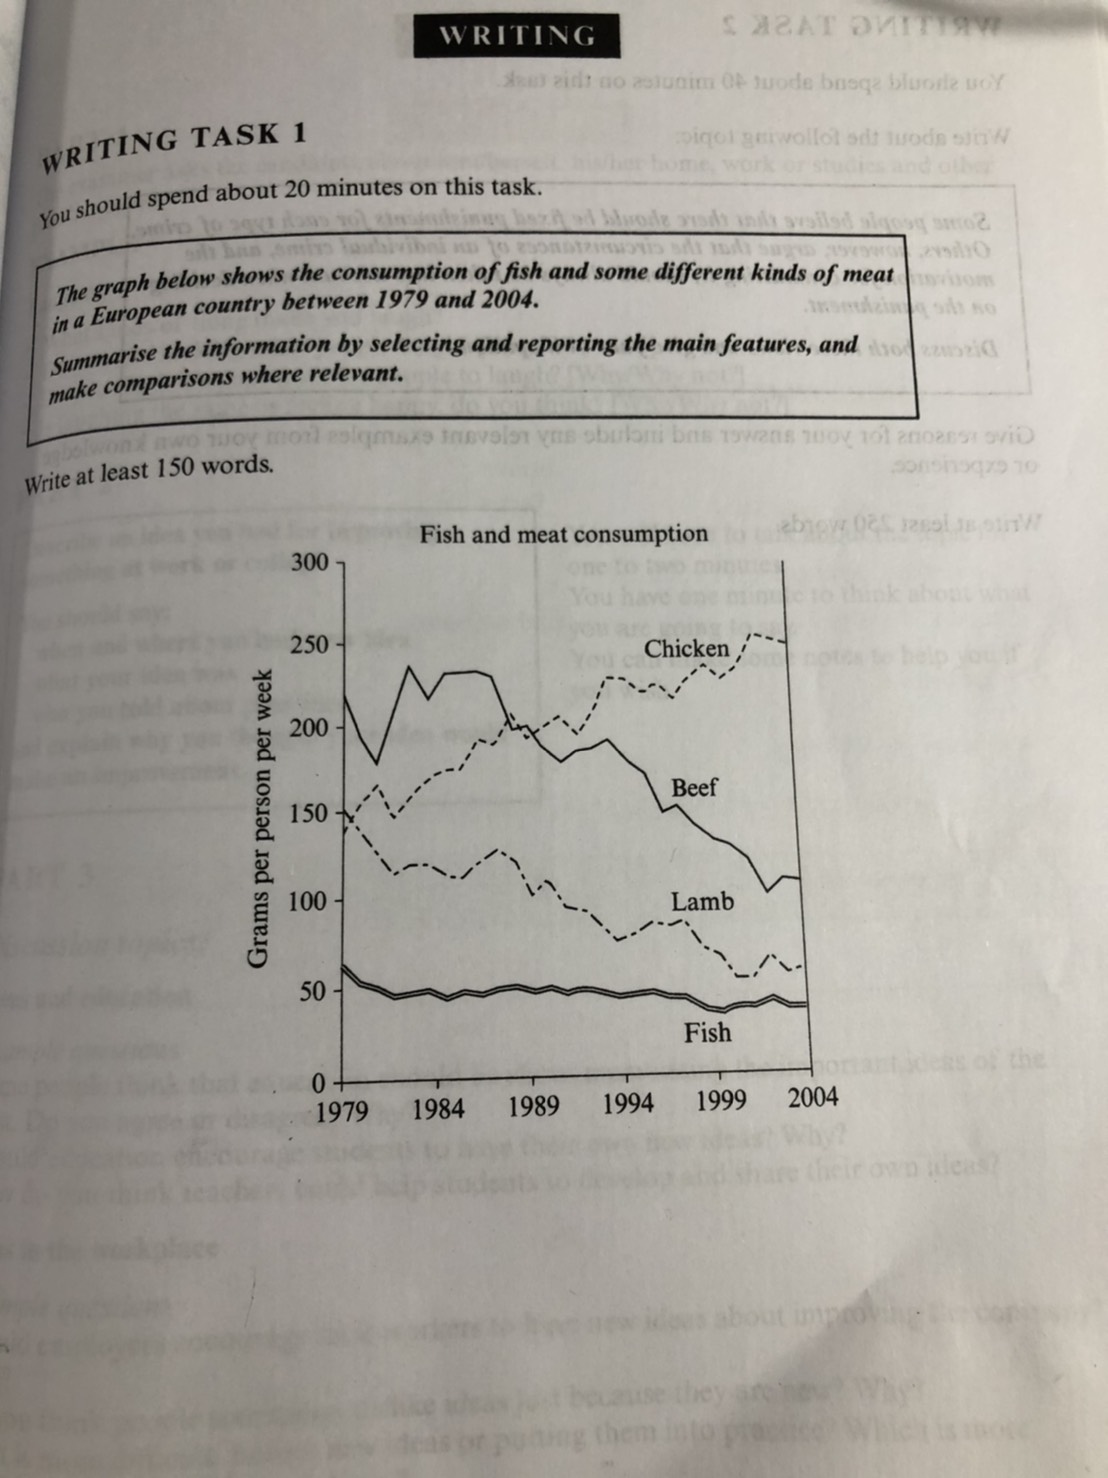
The line graph give information about a variety of livestock and fish that people in Europe consume from 1979 to 2004.As can be seen from the figure, there are different consumption for different meat and fish.
At the glance of data demonstrates that there was a dramatic increase in number of chicken by European over 25 year period.In contrast to chicken ,it is noticeable that the lamb and beef declined between 1979 and 2004.
The consumption of chicken was approximately 150 grams in 1979, than skyrocketed to 250 in the year of 2004. Although the beef was the most popular of these food ,with about 100 grams, increasing at the beginning. It is rapidly about 100 grams in 1986.
It is obvious that from the data that the lamp full down steadily from 150 grams to 60 over 25 year period. It is interesting to note that fish was remain stable about 60 grams for per person per week.

S__22511719.jpg
