Help me with my task 1 essay. How can I improve it?
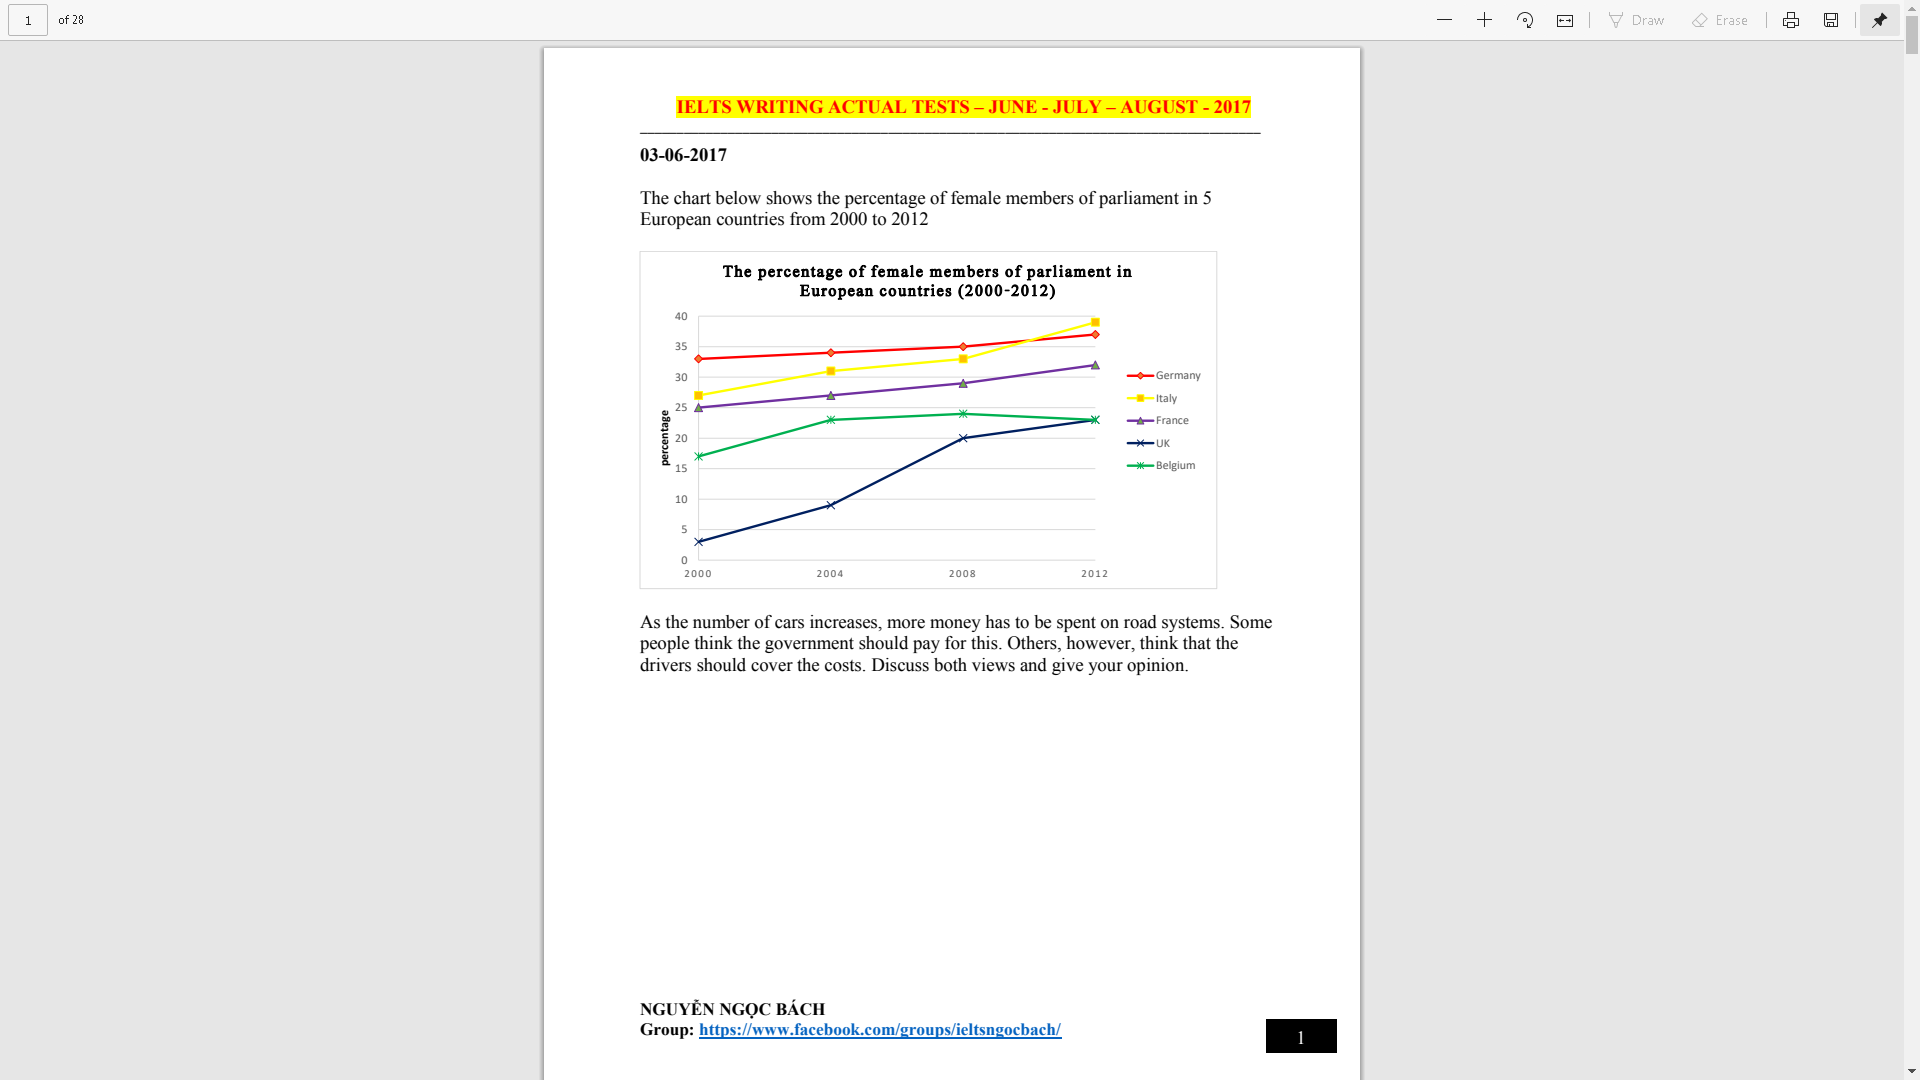
The line graph demonstrates the proportion of female members of parliament in 5 countries in Europe over a 12-year period between 2000 and 2012.
Overall, it is clear that whereas women joining parliament increase in percentage in all the examined nations except that of Belgium throughout the given period.
Focusing on Germany, Italy, and France, while Italy's and France's, at the beginning, were nearly the same, with 27% and 25% respectively, the figure for Germany was considerably higher, at about 34%. However, despite the data for all three countries increasing, in the final year, Italy witnessed an apex by any nation, which was a little below 40%.
Turn to Belgium and the UK, the former started with around 16% female members, which was approximately four times higher than that of the latter, at nearly 5%. In the next 8 years, the fraction of the UK surged to 20%. After that, while the UK female participants' proportion had climbed gradually, the Belgium's had seen an opposite trend by the year 2012. By the end of the period, the figure for Belgium fell to below 25%, which was similar to that of the UK.
Ielts test - chart analysis
The line graph demonstrates the proportion of female members of parliament in 5 countries in Europe over a 12-year period between 2000 and 2012.
Overall, it is clear that whereas women joining parliament increase in percentage in all the examined nations except that of Belgium throughout the given period.
Focusing on Germany, Italy, and France, while Italy's and France's, at the beginning, were nearly the same, with 27% and 25% respectively, the figure for Germany was considerably higher, at about 34%. However, despite the data for all three countries increasing, in the final year, Italy witnessed an apex by any nation, which was a little below 40%.
Turn to Belgium and the UK, the former started with around 16% female members, which was approximately four times higher than that of the latter, at nearly 5%. In the next 8 years, the fraction of the UK surged to 20%. After that, while the UK female participants' proportion had climbed gradually, the Belgium's had seen an opposite trend by the year 2012. By the end of the period, the figure for Belgium fell to below 25%, which was similar to that of the UK.

Task.png
