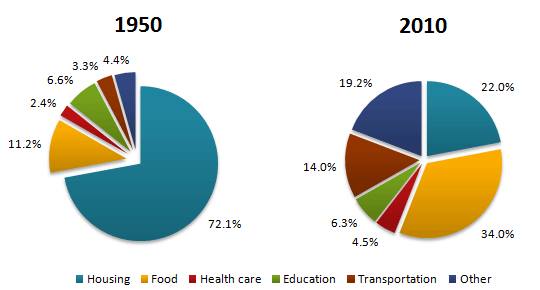
The pie charts below show the average household expenditures in a country in 1950 and 2010 .
The pie chart compares the proportion of money spent on different basic necessities in a country during six decades and it is measured in the percentage. Overall, all items saw an alteration. In this case, while housing and education experienced a decreasing trend, the opposite was seen in the remaining figures.
At the beginning, housing dominated all household expenditures at less than three-quarters, 6 times higher than the figure for food. Education came in the third with 6.6%. However, over the sixty following years, there was a decreasing trend in both figures with a significant decline showed by food, leading them to occupy the second and the fourth rate respectively.
Turning to the other items, there were four basic necessities showing an increase from 1950 to 2010. Initially, the proportion of food at 11.2% increased dramatically to 34% in 2010. Then, health care saw an alteration from 2.4% to 4.5%. The last necessity, transportation witnessed an increase which is almost same as the proportion of other, 3.3% to 14% for transportation and 4.4% to 19.2% for other.

AVERAGE_HOUSHOLD.jpg
