Unanswered [1] | Urgent [0]
  

Home / Writing Feedback   % width   Posts: 6


IELTS task 1: the proportion of the population aged 65 and over between 1940 and 2040


eddies [Contributor] 25 / 1170  
Jan 22, 2014   #1
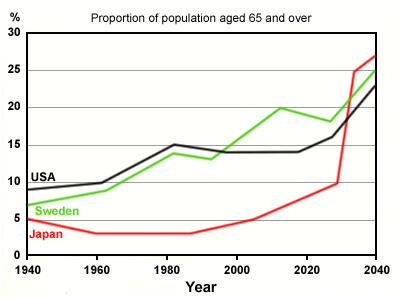
The graph below shows the proportion of the population aged 65 and over between 1940 and 2040 in three different countries.

Given is the line graph presenting the overall growth in ageing population during a period of 100 years. The expected percentages are taken from three different countries between 1940 and 2040.

Overall, the percentages of ageing population from two Western countries has risen steadily in ten decades. In any case, this proportion declined slightly in Japan, but will be gradual rebound from 2000 onwards.

From the graph, we can see the number of elderly people in Japan stood at 5%. After declining to almost 3% in 1960, this trend remained reasonably steady, then was gradual rebound to the same figure in 1940. Between 2030 to 2040, the increase in this proportion will be more dramatically.

A closer look at the data reveals that the numbers of ageing population in the two Western countries have no significant difference. Standing at approximately 9 % in 1940, the percentage of older population in USA increased steadily to 10 % in the next ten years, then followed by the proportion of Swedish population aged 65 or more rose from 6 to 8 percent. Both figures, after a short peak in the forth decade, decreased gradually. The percentage of older population in USA had remained steady in 14%, while this figure in Sweden had broken a record, peaking at 20% in 2010 but falling again in the ninth decade. The proportion of ageing population in USA and Sweden will be predicted to rise dramatically until 2040.

  • proportion_of_popula.gif


MisterWandering 18 / 314  
Jan 22, 2014   #2
Given is the line graph presenting the overall growth in ageing population during a period of 100 years. The expected percentages are taken from three different countries between 1940 and 2040

Don't make your introduction too complicated.
The line graph presents data concerning the changes in the proportion of ageing population over a 100-year period in Japan, Sweden and the USA.

the percentages

the percentage

n any case, this proportion declined slightly in Japan, but will be gradual rebound from 2000 onwards.

I think Japan experience an overall upward trend, too.

From the graph, we can see the number of elderly people in Japan stood at 5%

In 1940, the elderly people took up 5% of Japanese population.

this trend remained reasonably steady, then was gradual rebound to the same figure in 1940.

It then hovered around the 3% mark for nearly 60 years before increasing sharply for the rest of the period.

Between 2030 to 2040, the increase in this proportion will be more dramatically.

Notably, Japanese proportion of ageing population is projected to experience a nearly threefold rise to reach a peak of 28% in 2040.

the numbers of ageing population

It is the proportion/percentage, not the number of ageing population.

then followed by the proportion of Swedish population aged 65 or more rose from 6 to 8 percent

Sweden also saw a similar trend, though its figure was slightly lower, reaching 8% in 1980.

had remained steady

while this figure in Sweden had broken a record, peaking at 20% in 2010 but falling again in the ninth decade.

while there was a dramatic increase in the corresponding figure in Sweden to 20% in 2010.

will be predicted to

is predicted to
dumi 1 / 6793  
Jan 23, 2014   #3
The expected percentages are taken from three different countries between 1940 and 2040.

Well, this line has an issue. You can use the phrase "expected percentage" for the growth figures from then 2014 on wards. However, from 1940 up to date do not come under expectations.

Overall, the percentages of ageing population from two Western countries has risen steadily in ten decades. In any case, this proportion declined slightly in Japan, but will be gradual rebound from 2000 onwards.

Very good overview :)

A closer look at the data reveals that the numbers of ageing population in the two Western countries have no significant difference. Standing at approximately 9 % in 1940, the percentage of older population in USA increased steadily to 10 % in the next ten years, then followed by the proportion of Swedish population aged 65 or more rose from 6 to 8 percent. Both figures, after a short peak in the forth decade, decreased gradually. The percentage of older population in USA had remained steady in 14%, while this figure in Sweden had broken a record, peaking at 20% in 2010 but falling again in the ninth decade. The proportion of ageing population in USA and Sweden will be predicted to rise dramatically until 2040.

... It's good to have about two paragraphs to discuss the details of the graphs. I notice Pahan has suggested a good approach for this - he says it is good to group data according to their similarities and differences. Have one body para to discuss similarities and the other to discuss differences. I feel that's a very good approach to handle your body paras :)
OP eddies [Contributor] 25 / 1170  
Jan 23, 2014   #4
Hey Misterwandering.. I'glad you come to my writing. Well, I appreciate the notes you'given me above, then I'd like to say thank you.

Then, about this point ----- >

make your introduction too complicated.

I couldn't agree more. I was thinking of this, when the first time I brainstormed, but you know... I switched into "the complicated one", it is because I wanted to try whether this grammar/writing style is good enough to attract the readers' attention or not.

lucky me... , in the end, you came and highlighted some points about this, so I decide to think of twice if I want to deal with the report writing. Again, thanks.

Once again... I;ve read your IELTS writings in one of IELTS learning centres out there, then I'd really really want to say: Two Thumbs for all works you did. You give a hand for other learners.

- eddy
OP eddies [Contributor] 25 / 1170  
Jan 23, 2014   #5
Hi Dumi...,

Very good overview :)

----> I did it. Once I submitted my previous writing, you came to it in order to show some points that should be polished related to the overview. Then, I promised I'd show in the next. Above, that's the result. Thank you Dumi.

It's good to have about two paragraphs to discuss the details of the graphs.

...> Ah, that's that I need, but I don't know yet how to break it down into 2 paragraphs. No worries, I'll try it then.

For this notice, thanks for you, Dumi and Pahan.

- eddy
Pahan 1 / 1824  
Jan 23, 2014   #6
I notice Pahan has suggested a good approach for this - he says it is good to group data according to their similarities and differences. Have one body para to discuss similarities and the other to discuss differences. I feel that's a very good approach to handle your body paras :)

Ok... this is what I suggest'
Similarities - From 2030 onward the aging population of all three countries would start accelerating . Till 1980 both US and Canada followed almost same trends.
Differences - Japan had a sharp decline till 1960 while USA and Canada had an upward trend. Except for USA has others keep rising from 2000 to 2020

These things you can explain with details having the support of data.


Home / Writing Feedback / IELTS task 1: the proportion of the population aged 65 and over between 1940 and 2040
Need Writing
or Editing Help?
Fill out one of these forms:

Graduate Writing / Editing:
GraduateWriter form ◳

Best Essay Service:
CustomPapers form ◳

Excellence in Editing:
Rose Editing ◳

AI-Paper Rewriting:
Robot Rewrite ◳

Academic AI Writer:
Custom AI Writer ◳