Question :
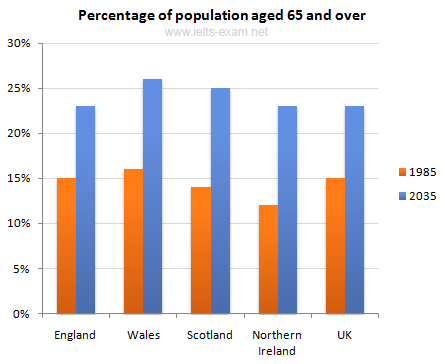
The chart below gives information about the UK's ageing population in 1985 and makes predictions for 2035
The bar chart compares the proportion of population aged more than 65 years old in the United Kingdom in 1985 and 2035. Overall, it can be seen that the highest number was in Wales and the smallest was in Northern Ireland. In any case, the percentage in Wales is going to the top in 2035, and Northern Ireland still the lowest.
To begin with in 1985, Wales saw the highest percentage approximately 16%, while England was in the second highest (15%). Interestingly, Scotland and Northern Ireland saw the lowest proportion (14% and 13% respectively).
A part from previous comparison, in 2035 Wales will reach 26%, and still settled in the top. While Scotland is predicted 25%, England and Northern Ireland have similar percentage about 23%. Totally, in the United Kingdom, the number of population over than 65 years old in 1985 was 15%, and will increase roughly 35% in 2035.

source : http://www.ielts-exam.net/
