TASK 1
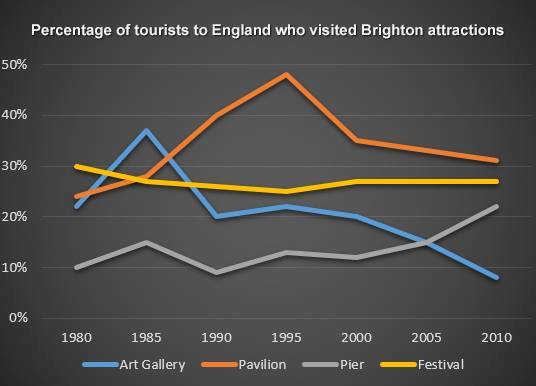
The line graph below shows the percentage of tourists to England who visited four different attractions in Brighton.
Answer:
A breakdown of the proportion of the visitors to England who enjoy four different tourist attractions in Brighton between 1980 and 2010 as a projected year, a three-decade period, is revealed in the line graph. At first glance, from the beginning to the end period, all categories attractions displayed a fluctuation, however, the pavilion and festival were the highest figures over all the years.
There were four categories of the attractions such as Art gallery, Pavilion, Pier, and Festival which became choices of destination attractions for tourists to come to Brighton. By 1980, it had been beginning period that showed the Festival having the highest rate of 30%, while the lowest figure was 10% for Pier. Between Art Gallery and Pavilion stood at 22 and 24 percent, respectively.
In the middle of period, 1995, the visitors who came to England to select the attractions such that Pavilion increased significantly twice to 48% and Festival decreased steadily by 5 percent. Then, Art Gallery unchanged at 22% for visitors and Pier had a small rise of 13%. On the other hand, in the end of period (2010), Pavilion and Pier witnessed a dramatic incline of tourists to see these attractions to 31%, and 12%, respectively, whereas Art Gallery and Festival dropped to 8% and 27%.

12729155_11018453765.jpg
