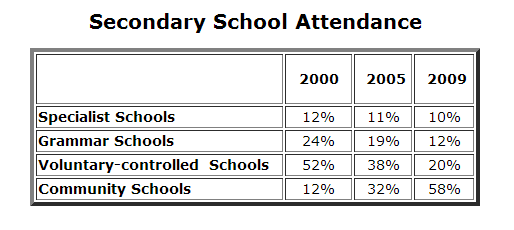
This table displayed the quantity of students which join in the Secondary School, in three different years. Overall, there are essential changes in calculation of each school.
It is evidence that in Specialist Schools, the percentage of student's presence are slightly decrease of from year 2000 to 2009. In the Grammar Schools, the percentage fall significantly, by the end of the year it is just a half than the first year. In Voluntary-controlled Schools can be seen that the number of declining is very extreme, it has decreasing by 14% in 2005, and has fell 18% more in the last year.
However, in Community Schools, the attendances percentage have an amuse increment. In the second year, it has rose more than twice as the first one. The most important thing is that Community School has the highest percentage in the very end of the year compare to all schools in the same time.

ES8.png
