the number of enquiries - the graph
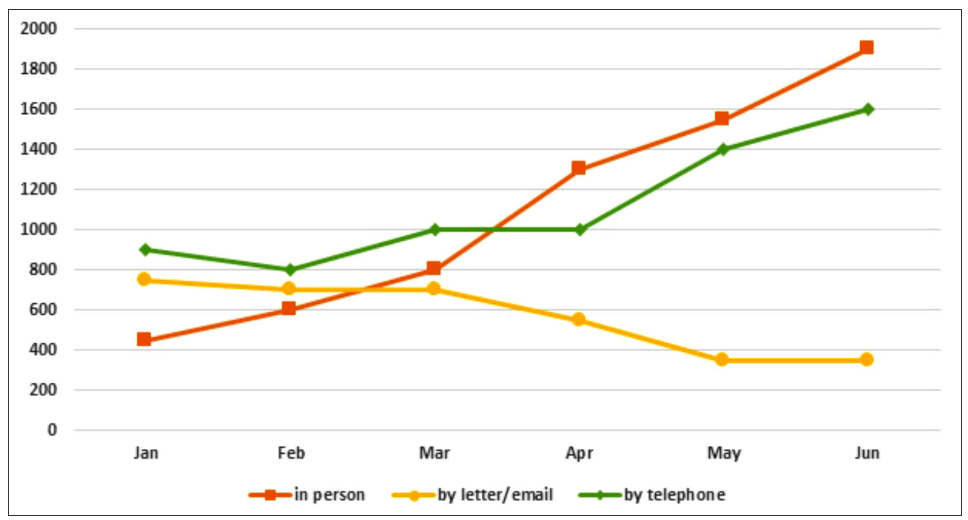
The line graph depicts the questions received by the tourist information office in six months from January to June in 2011 in three methods are in persons, by letter or email, and by telephone.
Overall, the tendacy of asking directly at Office was increasing stably, on the contrary the way of asking by letter or email decreased sharply. Otherwise, the enquiries received by telephone was fluctuately.
At the beginning of the year 2011, the tourist information office was received only 400 questions which asked directly in persons, this figure was the lowest compared to other two figures of following questions received by letter/email and telephone, which were nearly 800 and 900 enquiries. However, the enquiries were asked in person shaw a significant stable increase in the following months until reach a peak at 1900 questions in June, also became the highest data among three ways. Coversely, the figure of questions received by letter/email got a downward trend to the lowest which was approximately 400 enquiries in same period.
Although the data of questions that tourist informtion center received by telephone saw a slight fluctuation from January to March and remained unchanged in one month till April, it could grow up to 1600 enquiries in June. Despite the fact that at the beginning it was the most preffered method to send the question to the Office, over a six-month period it turned out to be the second.

Screenshot2023081.png
