remzy /
Jul 19, 2013 #1
Could you please review my essay? Do I need to mention all of the details, especially the numbers in my essay? Thank you very much.
Writing task 1. The charts below show the results of a survey of adult education. The first chart shows the reasons why adults decide to study. The pie chart shows how people think the costs of adult education should be shared. Write a report (at least 150 words) for a university lecturer, describing the information shown below.
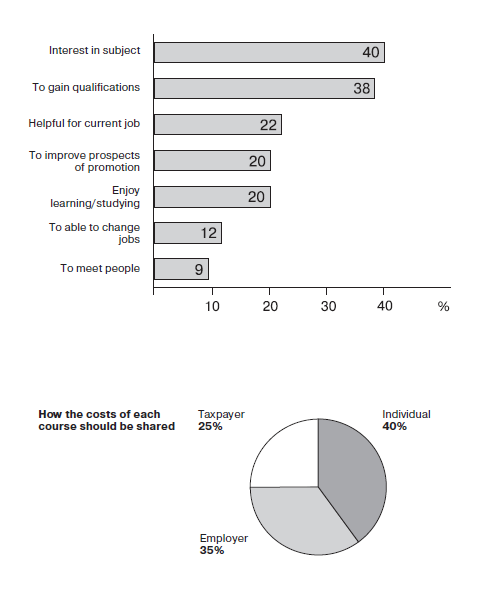
The horizontal bar chart demonstrates the adults' seven reasons for education, in percentage. According to the (bar) chart, the highest percentage belongs to the interest in subject, with 40%, while (it appears that) 9%, which is the lowest one in the chart, is devoted to meeting people. The second largest item after the interest in subject, with only a two-percent/2% difference/decrease, is to gain qualifications, with 38%. It can also be seen that both improving prospects of promotion and enjoyment of learning/studying, each (one) with 20%, are equally important among adults. To be helpful for current job, with 22%, and to be able to change jobs, with 12%, take the third and the fifth places in the bar chart, respectively.
The pie chart illustrates, in percentage, the proportion of three different sections to share each course's costs. As it is shown in the (pie) chart, people think that three sources, which are individual, employer, and taxpayer, should consider the adults' education costs. The individual, with 40%, is/has the largest proportion, and the second one is the employer, with 35%. The third/last part, which constitutes one-fourth of the sharing, is the taxpayer.

uuuuuuuuu.png
