Writing Task I (November 3, 2016)
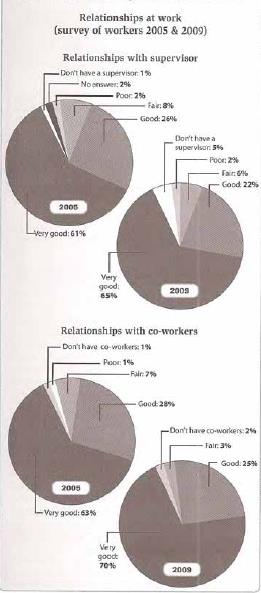
The charts describe the results of questionnaires about employee relationships with their managers and colleagues in workplace after five years gap in 2005 and 2009. Overall, both of pie charts show that "very good" is the most choices of employees as the description of their relationships towards their managers and peer-workers and had been slightly increased over the years in 2005 and 2009.
Based on the grouping of pie charts first type which describes of relationships between employees and their managers had shown that there are less 10 % of employees who give answers "fair" and the employees who not have managers has been fewer in 2005 with 1% than in 2009 with 5 % after had increased by 4 %. Almost the answers of employees around on extremely "very good" choices which had been steadily above 60 % since in 2005 until 2009 %.
Same conditions with the pie charts second type which provides information on relationships between employees and their colleagues had shown that there are less 3 % of employees who not have co-workers in their jobs. A closer look reveals that "very good" answers is the highest percentage of employees opinions about their co-workers with consistently above on 60 % after had increased significantly by 7 % from 2005 t0 2009.
(215 words)

Wrting_Task_2_IELTS_.jpg
