utilization of energy in the USA
question:
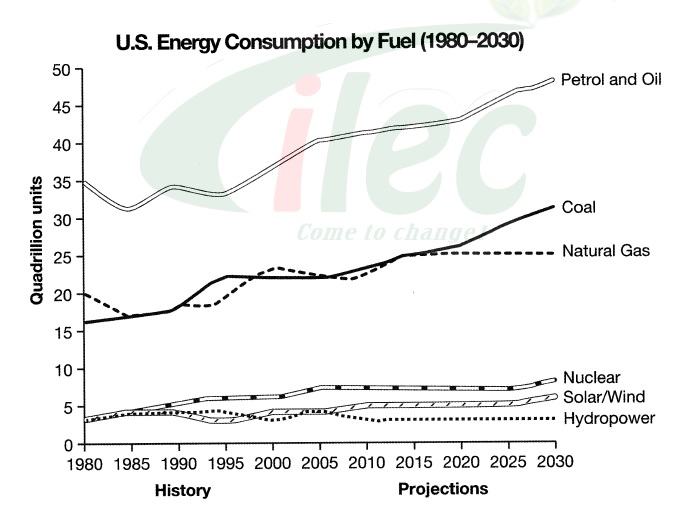
The graph below gives information from a 2008 report about consumption of energy in the USA since 1980 with projections until 2030.
The graph compares the utilization of energy in the USA since 1980 and also gives a projection of it till year 2030.
It is clear that petrol, oil and coal accounted as high units of fuel consumption over the given years as opposed to Nuclear,solar/wind and hydropower.
Now turning to the details, about 35 quadrillion units of petrol and oil was consumed in 1980 which fluctuated and then the figure surged to 40 quadrillion units in 2005 which will move upto 48 quadrillion units in 2030. coal and natural gas will follow the same trend starting at about 16 and 20 quadrillion units respectively in 1980 and crisscrossing each other over the years till 2015 when both reach 25 quadrillion units. The projections show coal will gradually increase to above 30 quadrillion units in 2030 whereas natural gas will level out at 25 quadrillion units.
On the contrary, Nuclear and solar/wind energy's consumption figures rise up in tiny amounts from under 5 quadrillion units in 1980 to between 5-10 quadrillion units in 2030. whereas hydropower energy consumption remains same (about 4 quadrillion units) over the whole period.
(187 words)

linegraph.jpg
