Japanese tourist market report
Original Prompt:
You should spend 20 minutes on this task
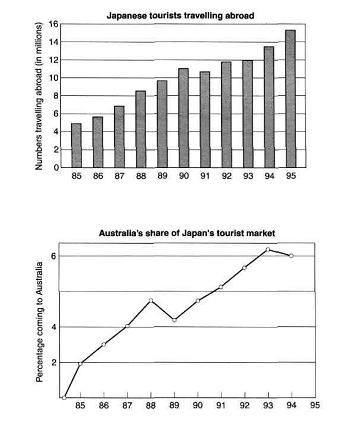
The chart below shows the number of Japanese tourist traveling abroad between 1985 and 1995 and Australia's share of the Japanese tourist market.
Write a report for a university lecturer describing the information shown below.
You should write at least 150 words
My Respond:
The bar chart illustrates the number of Japanese overseas traveler, measured in millions, and the line graph measures Australia's share of the Japanese tourist market. Both are during 1985 to 1995. Overall, Japanese overseas traveler rate increased over the period, interestingly it can also be seen that Australia's share of Japanese tourist market experienced the same trend.
To begin, in 1985 the number of Japanese traveler stood at 5 million travelers, and then increased significantly to 11 million travelers in1990. However, there was a small decrease to 10 million travelers in 1991, but then it gradually rose with the rate reaching a peak of 15 million travelers in 1995.
Quite similar to Japanese overseas traveler trend, Australia's share of Japanese tourist market also showed a gradual increase from 2 percent in 1985 to 5 percent in 1988. Despite having a small decrease to 4 percent share in 1989, there was a rapid rise with the rate reaching a peak of 6.5 percent share in 1993. However, unlike Japanese overseas traveler rate, Australia's share of Japanese's tourist market fall slightly to 6 percent in 1995.

image1.png

