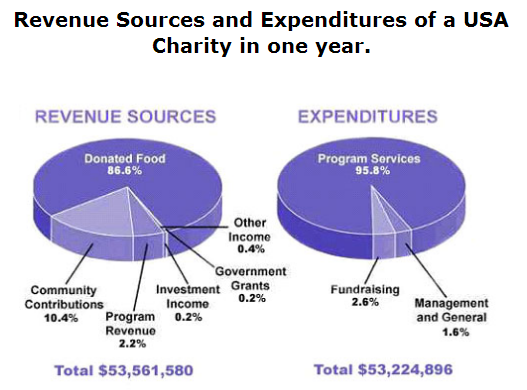
The percentage of revenue sources and expenditures in a USA charity during one year displayed on the pie charts. As it is noticeable, the largest amount of proportion seemed to donated food among other revenue sources and there is a very large majority to program services among other expenditures.
Management of USA charity looks revenue sources which the greatest sources to organize are donated food at 86.6% and it is followed by community contributions of 10.4%. An amount left of minority are program revenue at 2.2% while there are similar percentage between investment income and government grants which both of them contribute to 0.2%. Then, other income also attached with a very small number at 0.4%. Overall, the amount of chased are $53,561,580.
Turning to expenditures, it is almost one hundred percent by a margin of 4.2% that sources are allocated to program services, whereas the other expenses such as fundraising, management, and general have a minority under 3%. Overall, the amount of chased are $53,224,896.

ES7.png
