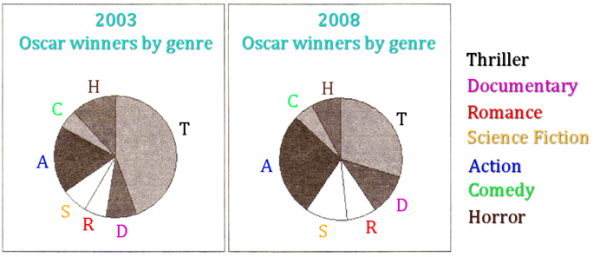
The share of Oscar winners by genre film for 2003 and 2008
Oscar winners by genre film
The pie charts show the changes in the share of Oscar winners by genre film for 2003 and 2008.In general, thriller is the genre film that spent the most percentage of the proportion of Oscar winners in 2003 and 2008. But this genre got a significant decrease in the number of Oscar winners from almost half to a third of total Oscar winners. The least amount of the proportion of Oscar winners is comedy film at about 5 percent and in the same for 2003 and 2008.
The action film is the genre that got a second position of the number of Oscar winners but it's has a steadily went up from 20 percent to approximately a third in 2008. The horror film had a slight decrease from 7 percent to over 5 percent in 2008.
The other differences were Romance, Documentary and Science Fiction had a slight increase in 2008.

6_pie.png
Holt Educational Consultant - / 16009 Kien, your essay is missing the most important part, the summary overview. While there is no specific spot for you to place this overview statement, it is important that you place it in an obvious part of the paragraph setting. My advice is to place it at the start of the essay. The overview must contain specific elements which will help you meet the task accuracy requirement. The paragraph must contain:
1. The topic for discussion
2. The illustration provided
3. The measurement criteria inclusive of the audience being recorded
4. The discussion instructions
These comprise the required outline discussion that will help the reviewer keep his place while reading your essay. What I outlined will need to be presented in sentence format within 3-5 sentences. The final sentence, should be a transition into the actual discussion. Only after this presentation should the paragraph that had specific information be presented.
Create longer presentations in your essay. It has to be at least 3 sentences per paragraph. When your paragraphs amount to only single sentences, it signifies that you did not bother to truly analyze the image presented and you are just "winging it" in terms of presenting the obvious information. The task 1 essay is more analytical in presentation. So you need to make sure that you provide accurate information to the reader, who will have no idea what the image actually contains. So you need to be accurate at all times.
I am wondering where you got the specific numerical figures for the essay because there is no indication of numerical data in the pie chart. You only have letter representations which you should have used in your essay. If the information is not in the graph, chart, or whatever, it should not be in your presentation because that makes your summary inaccurate in presentation. That is, unless you did not provide the complete information for review with your essay? Which will explain why you have specific numbers to refer to but I cannot see it in the file so I cannot assess the accuracy of your factual data.
ⓘ Need academic writing help? 100% custom and human!

