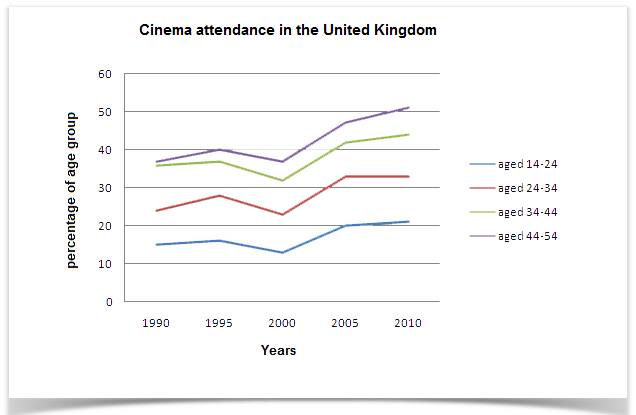
A breakdown of information about visitors in cinema based on age groups in the United Kingdom per five years from 1990 to 2010 as a projected year is illustrated in the line chart. The data is shown in per cent. Overall, it can be seen that despite some fluctuations, over the period as a whole the levels of viewers rose in four age groups.
Aged 44-45 and 34-44 was the two highest percentages. Over the end of period they showed at fairly similar level. By 1990, they had nearly proportion between 37% and 35% respectively. There were slight decline in 2000 for both categories. However, form 2005 and 2010, the percentage of two age group increased significantly in order to end up at more than half for aged 44-54 and 33% for aged 34-44.
Turning to other categories, also, aged 14-24 and 24-34 had almost same trend. The proportion of people watching movie in the first categories stood at 15 as the lowest percentage, while another was up one in ten. During 1995 to 2005 witnessed a similar fluctuation. Finally, they remained stable until the end of the period at 3more than a third and a fifth successively.

12592255_10201329162.jpg
