WRITING TASK 1 ACADEMIC The table analysis
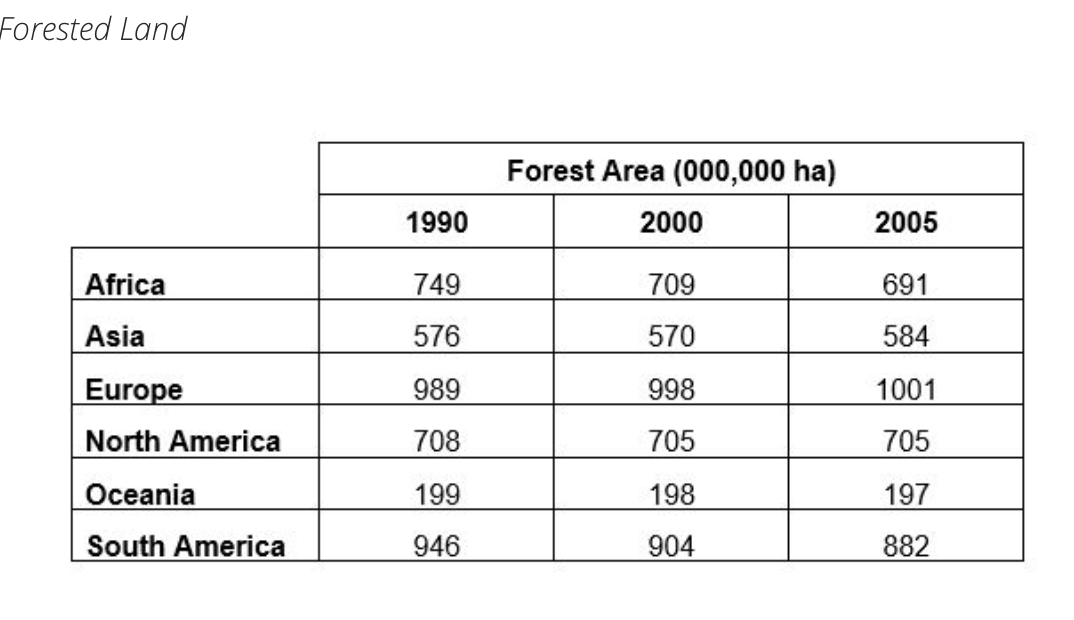
The table compares the data on forested land in different continents from 1990 to 2005, measured in millions of hectares.
It is evident that the vast majority of the forest was denser in Europe and South America than in other areas, while the area of forest in Europe increased during the period shown, the opposite can be seen in other regions.
As far as Europe is concerned, the forested land of which initially stood at 989 million hectares in 1990, which was ranked in the first. It then rose by merely 10 million in 2000. Five years later, in 2005, the figure showed a minimal growth to 1000 million which was far larger than that of Oceania (197 million). The area of forest in Oceania was the smallest among others, which fluctuated around 200 million throughout the period shown.
As is illustrated from the graph, the forested area in North America was more than 700 million, followed by a small rise and reached a plateau of 705 in 2005.
Thank you for your feedback.

ScreenShot202107.png
