select and report the main features from the graph
The table below shows the percentage of main types of dwelling in Victoria, the Northern Territory and Tasmania . Summarize the information by selecting and reporting the main features and make comparison where relevant
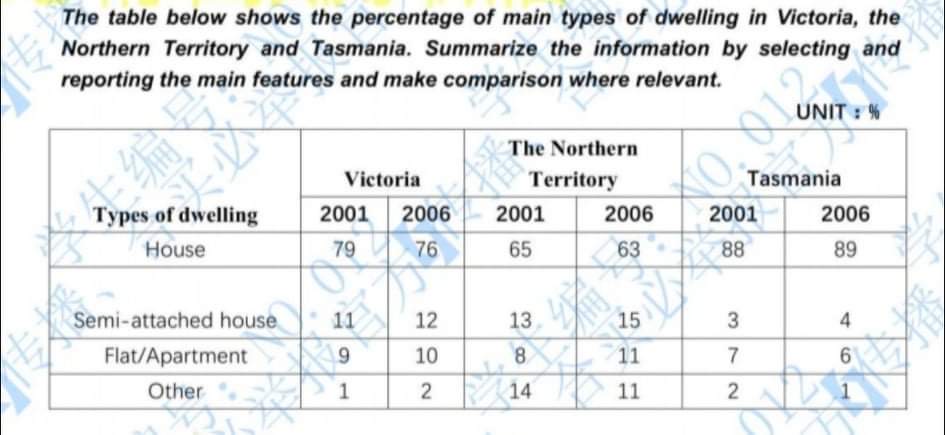
The figure illustrates the ratio of major types of residence including house, semi-attached house, flat and other in three different places throughout from 2001 to 2006. overall , the residents ' preferences for the living place in all of these areas had changed slightly by 2006, compared with the 2001 figures.
Obviously, the house regularly was selected highest in three regions by residents over a period of 5 years. In Tasmania , there was a remarkable increase in in amount of house at 88% in 2001 and 2006% , compared with Victoria, the Northern Territory were decrease slightly from 79% to 76% and 65% and 63% respectively .Nevertheless, the other categories were much smaller, in semi-attached house tended to live in the Northern Territory , there was a significant drop approximately at from 13% to 15% respectively and victoria at 11% and 12% and in tasmania ocuppies 3% and 4%.
Apparently, the number of flats still constructed for people live in three regions but not pay attention more than house and semi-attached house and just accounted smaller consists of 9% to 10% in victoria , 8% to 11% in the northern territory and 7% to 6% in tasmania .Finally, the other types of residence declined considerably at 1% to 2% respectively in victoria and 2% to 1% in Tasmania but the northern Territory, the other types of dwelling toward to grow up substantially approximately 14% to 11% from 2001 to 2006.

51B339B9020E43548.jpeg
