Comparison of spreads usage
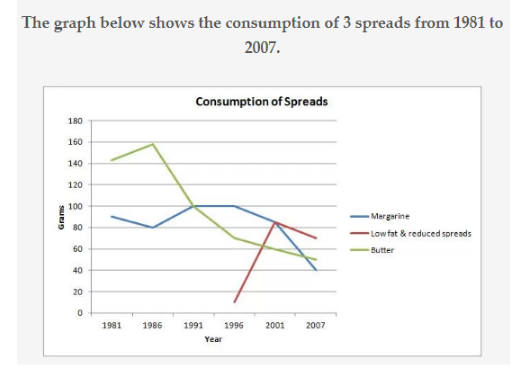
The line graph illustrates the usage of three spreads, including margarine, low fat & reduced spread and butter between 1981 and 2007.
Overall, the number of these three spreads taken by consumers fluctuated. Both consumptions of butter and margarine decreased while the usage of low fat & reduced spreads rose.
Initially, there were around 90 grams of margarine spreads. The number then went up and down and reduced enormously to 40 grams in 2007. Originally, the consumption of butter is the largest among all of them in 1981 (around 145 grams), it then rose sharply to 160 grams in 1986 and reduced dramatically to 50 grams in 2007. For low fat & reduced spreads, the consumption started in 1996, it goes up rapidly to around 80 grams in 2001 and declined slightly to 70 grams in 2007
At first, the number of butter spreads outweighed the margarine spreads, and both of their numbers were larger than low fat & reduced spreads in 1996. However, at last, low fat & reduced spreads overtook both butter and margarine spreads in 2007 with the differences of around 20 grams.
[186 words]
Please give a score for my essay, thank you!!

the graph
