Unanswered [1] | Urgent [0]
  

Posts by evamusifa
Name: Eva Musifa
Joined: Sep 5, 2017
Last Post: Sep 6, 2017
Threads: 1
Posts: 2  
From: Indonesia
School: Sriwijaya University

Displayed posts: 3
sort: Oldest first   Latest first  | 
evamusifa   
Sep 5, 2017
Writing Feedback / (IELTS Task 1) a pie chart describing water purposes - for analysis [6]

Tommy, for me, you lack putting comparison in both data (you may compare between developed and developing country directly)
for example : approximately half of industrial water use in North America and Europe as the developed countries. The reverse is seen in the developing country particularly in Africa people using merely on in ten of total.

How you paraphrase the question also does not organize well (perhaps, you no need list the countries because "developed and developing countries" are enough to illustrate the data

for the last paragraph also lack of synthesizing and comparison, you tend to list the percentage from the the data
evamusifa   
Sep 5, 2017
Writing Feedback / Spending whole time doing the same things is better than change? [4]

Personally, I strongly believe that change is always a very "good thing". I think good is weak vocabulary and also thing is not specific.

try to avoid to use cohesive devises in each sentence.

In your body paragraph you tend to use word "thing" that i think this word is vague.

for the second body paragraph, i suggest you to write the concrete example about different activities that make introvert's life becoming more developed or funnier.

You may also put the data in your second body paragraph, for example :
Particularly, in a modern world like these days, change is an inevitable trend. According to the research reveals that 65% people worldwide move from their comfort zone to a new life by doing activities.............

Our lives will become funnier, more colorful and meaningful if we have many different things to do everyday (this sentence i think is jumping idea).

Also, your conclusion is not illustrate a whole information from your essay.
evamusifa   
Sep 6, 2017
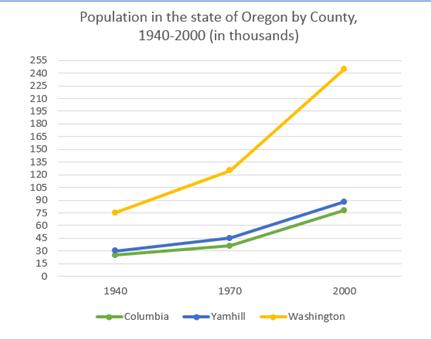
Writing Feedback / A change of population measured in thousands in Columbia, Yamhill and Washington [3]

population in the state of oregon


A change of population measured in thousands in Columbia, Yamhill and Washington from 1940 until 2000 is provided in the line graph. Overall, the number of people in all countries experienced upward trends over the period. However, the figure for Japanese people took place as by far the most significant growth in population.

In 1940, There was a noticeable growth in Washington population with three-fourths of total population, while for Columbia and Yamhill, population growth halved of Washington's people. These figures saw the same number of population in Washington in the eventual year. In 2000, the bracket of Washington rocketed to threefold of population in 1940

A more look at the graph reveals that the figures for Yamhill and Columbia's population witnessed a slight increase at 30 and 45 thousand people respectively in 1970. The reverse was seen in the number of Washington's people growing dramatically to over twice number of the formers. It then reached a peak at the end of the period to hefty 135 thousand people increase.


  • eppa.PNG
Need Writing or Editing Help?
Fill out one of these forms:

Graduate Writing / Editing:
GraduateWriter form ◳

Best Essay Service:
CustomPapers form ◳

Excellence in Editing:
Rose Editing ◳

AI-Paper Rewriting:
Robot Rewrite ◳

Academic AI Writer:
Custom AI Writer ◳